TL;DR - I ran 3,800 controlled experiments across three frontier AI models (GPT-4o, GPT-5.4, Gemma 4 26B) to measure one thing: does the quality of metadata surrounding your data actually change how reliable your AI agent is? The answer is yes - but with a twist that changes everything about how you should think about model selection.
The Question, Generally We Get Wrong
When an enterprise AI system fails, the instinct is to blame the model. Swap GPT-4o for GPT-5. Try a different vendor. Throw more parameters at it.
After years of building production AI systems for pharmaceutical and manufacturing clients - I kept seeing the same pattern: the model wasn’t the bottleneck. The data context was.
A pressure gauge reading of 2847.3 means nothing in isolation. Is that high? Low? Normal for this phase of the batch? Is this sensor reliable? What does it influence downstream? Without answers to these questions, even the most powerful AI model is reasoning in the dark - and it will do so confidently, which is the dangerous part.
This is the problem of data contextualization: enriching raw data with the metadata, annotations, and environmental context that transforms a number into a diagnostic signal.
“Raw data, in its primitive state, represents a collection of disconnected signals - timestamps, sensor readings, transaction logs - that lack the inherent situational relevance required for high-stakes decision-making.”
I wanted to test this rigorously. Does context quality actually, measurably affect AI agent reliability? Can I quantify it? Can I automate fixing it? And - the question I didn’t think to ask until the data forced it - does the answer change depending on which model you use?
The Setup: How I Measured This
The Dataset
I used the Tennessee Eastman Process (TEP) - a canonical benchmark from chemical engineering that simulates a real industrial plant with 52 sensors across a reactor, separator, stripper, and compressor. It includes 21 fault conditions, making it ideal for testing diagnostic AI. Crucially, because it’s a simulation, ground truth is fully deterministic - i always know the right answer, which makes scoring possible.
The Independent Variable: Five Levels of Context
Rather than comparing models directly, i designed the experiment to isolate context quality as the variable under study. I defined five levels of metadata richness and wrapped the same underlying sensor data with each:
| Level | What’s Added | Example |
|---|---|---|
| L0: Raw | Just 52 sensor readings | XMEAS(7): 2847.3 |
| L1: + Temporal | Phase labels, shift, time-in-run | Phase: steady_state, Shift B |
| L2: + Semantic | Tag-to-concept mappings | XMEAS(7) → reactor_pressure (kPa, reactor subsystem) |
| L3: + Lineage | Upstream dependencies, transformation steps | reactor_pressure ← feed_a_flow, feed_d_flow |
| L4: + Quality | Completeness flags, reliability scores | Out-of-range: 0%, Quality: 0.86/1.0 |
The same fixed AI pipeline processed every condition - task orchestrator, semantic retrieval, and reasoning agent. Five task types: anomaly diagnosis, batch comparison, deviation explanation, trend forecasting, and root cause analysis. 30 trials per condition.
Three Models, One API Architecture
I tested three frontier models at temperature=0.0 for full reproducibility:
- GPT-4o: OpenAI direct API ($2.50/$10.00 per 1M tokens)
- GPT-5.4: OpenAI’s latest frontier model
- Gemma 4 26B MoE: Google DeepMind, via OpenRouter ($0.12/$0.40 per 1M tokens)
All three were called through the same pure Python codebase - no LangChain, no framework abstractions. For Gemma 4, I used OpenRouter’s OpenAI-compatible endpoint with a single base URL change. The entire Gemma 4 experiment - 750 trials - cost $0.38.
Total: 3,800 scored outputs (2,275 baseline + 1,525 CEL framework trials).
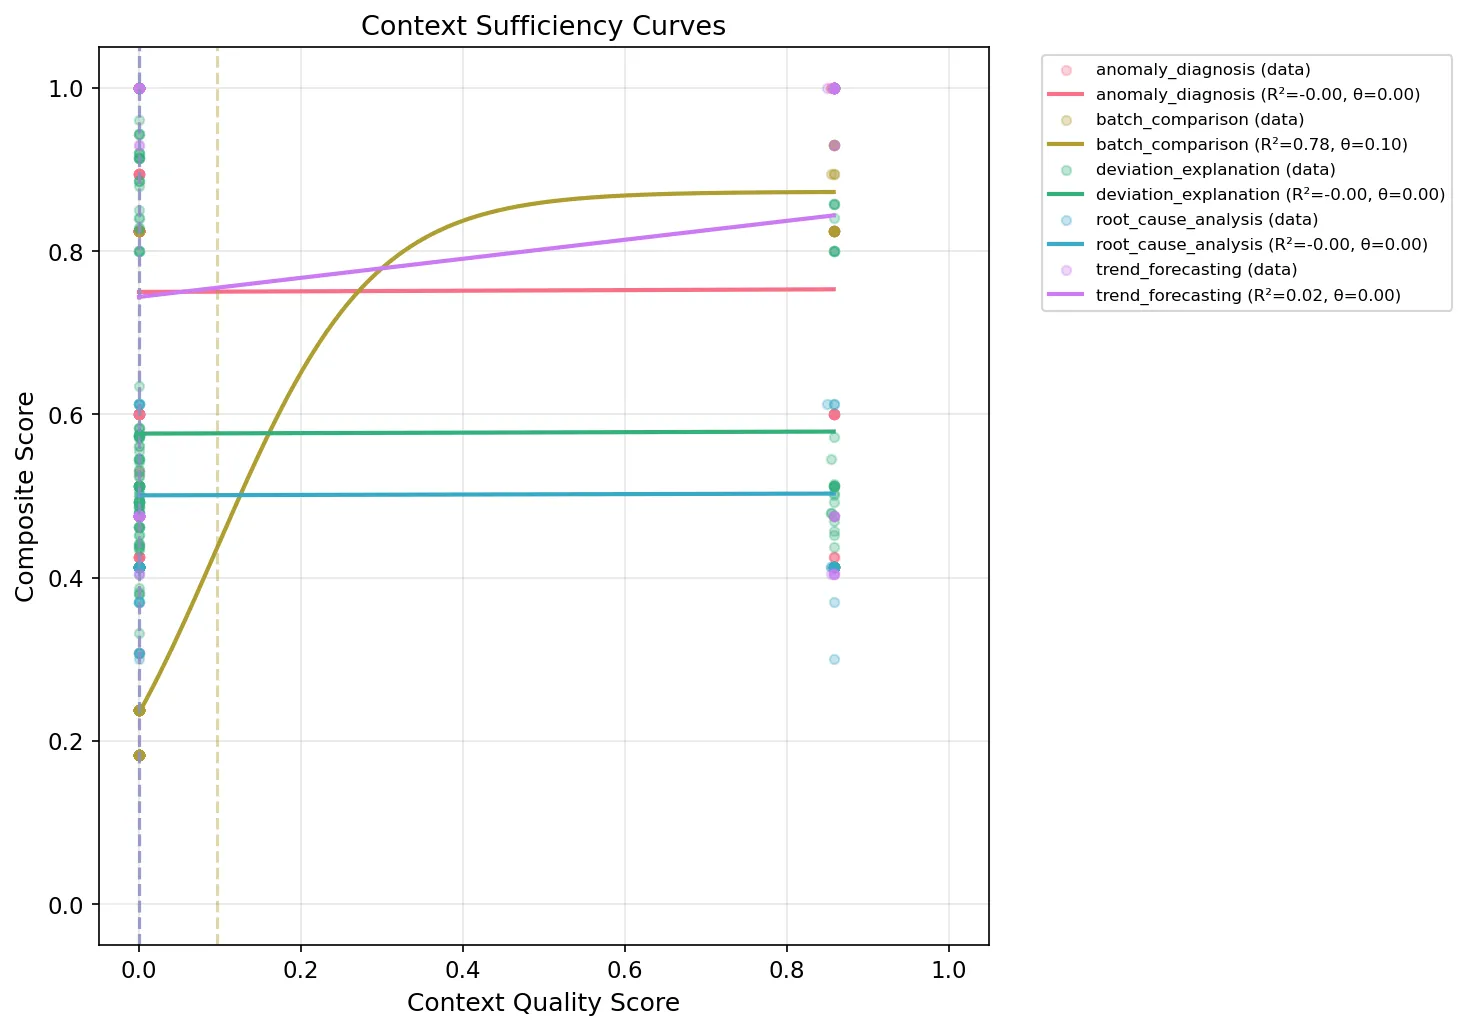
Context Sufficiency Curves (GPT-4o)
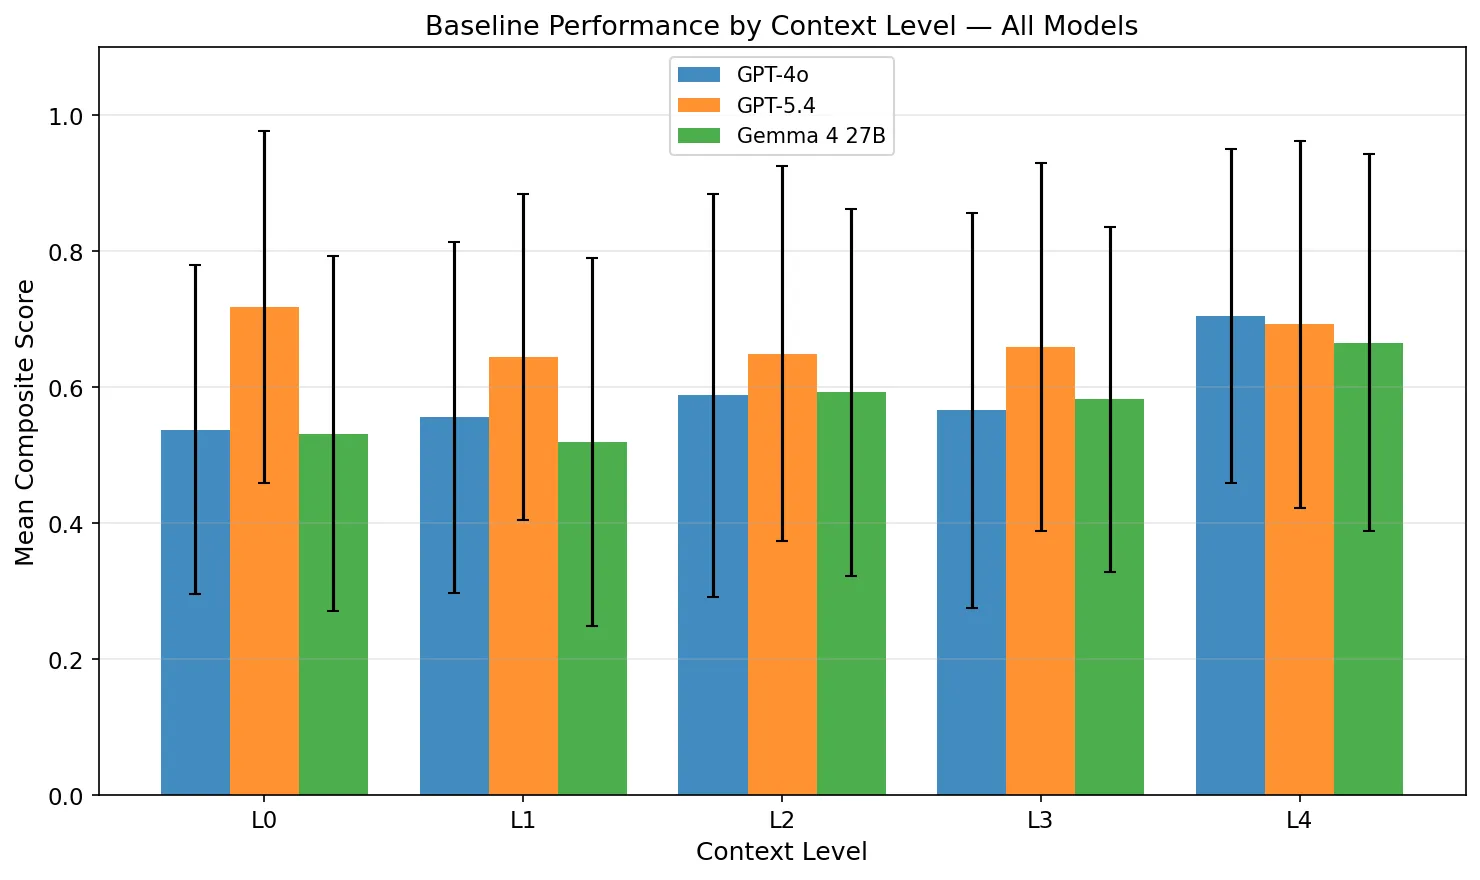
All Three Models by Context Level
Finding 1: Context Quality Improves Reliability - But Not Equally Across Models
The aggregate headline: context quality has a statistically significant positive effect on AI agent reliability (GPT-4o: r=0.210, p=3.9x10⁻⁹; Gemma 4: r=0.161, p=9.2x10⁻⁶).
But the per-model story is where it gets interesting.
| Model | L0 Score | L4 Score | Improvement | Correlation |
|---|---|---|---|---|
| GPT-4o | 0.537 | 0.705 | +31.2% | r=0.210, p<0.001 |
| Gemma 4 26B | 0.531 | 0.665 | +25.2% | r=0.161, p<0.001 |
| GPT-5.4 | 0.717 | 0.692 | -3.5% | r=0.038, p=0.30 |
GPT-4o and Gemma 4 respond to better context the way I hypothesised. GPT-5.4 does something completely different: it starts so high at L0 (0.717) that adding metadata actually slightly decreases its average score. Its correlation with context quality is not statistically significant (p=0.30).
What this means: GPT-5.4 appears to have substantially solved the context dependency problem internally. It extracts sufficient signal from raw sensor patterns alone that additional metadata provides minimal marginal value - and in some cases introduces noise it has to reason past.
This is the most commercially important finding in the study.
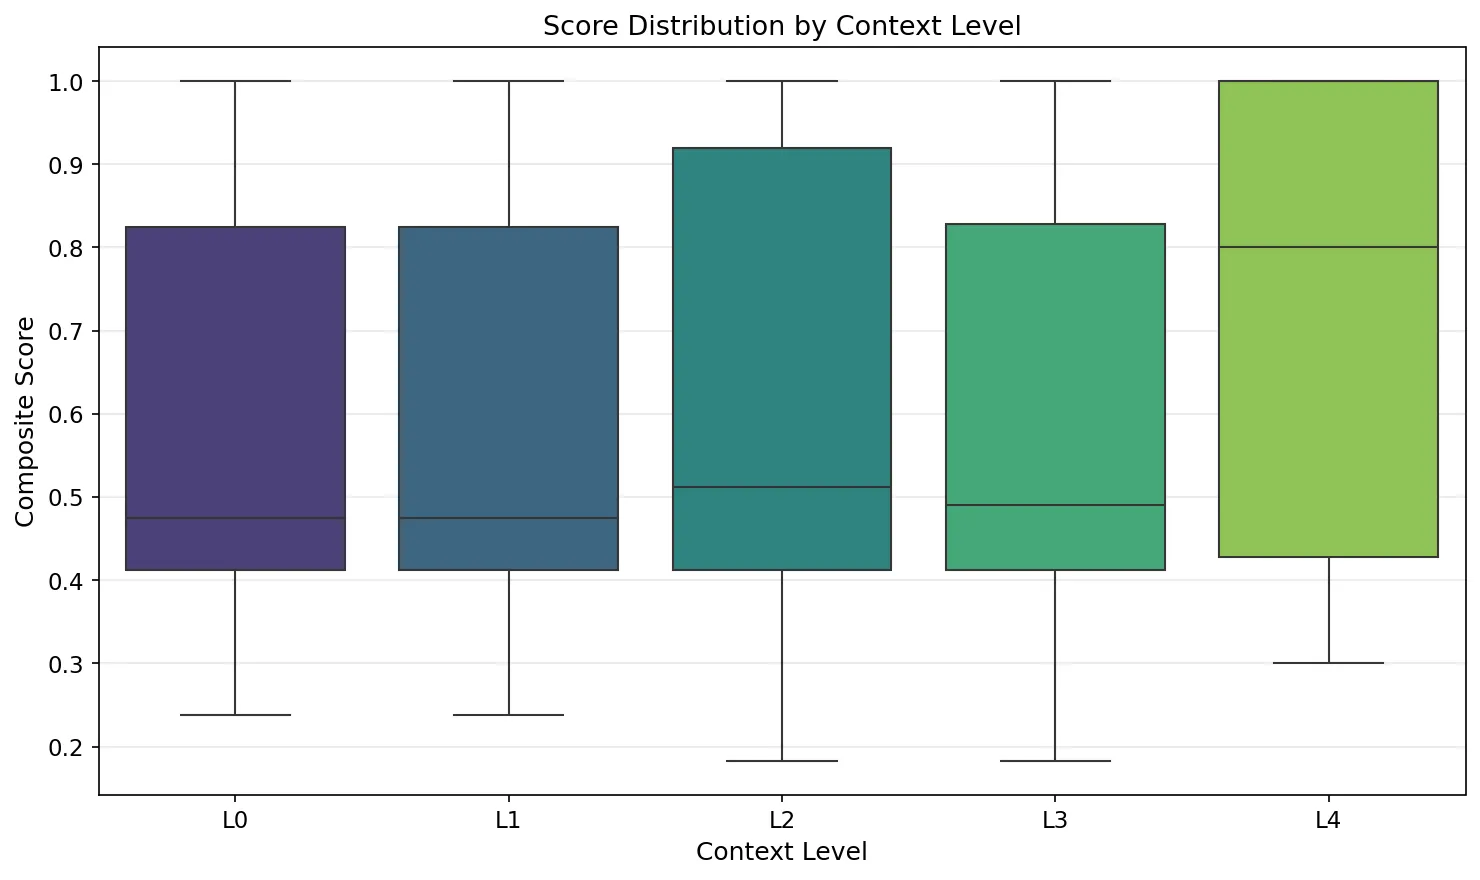
Score Distribution Boxplots by Context Level (GPT-4o)
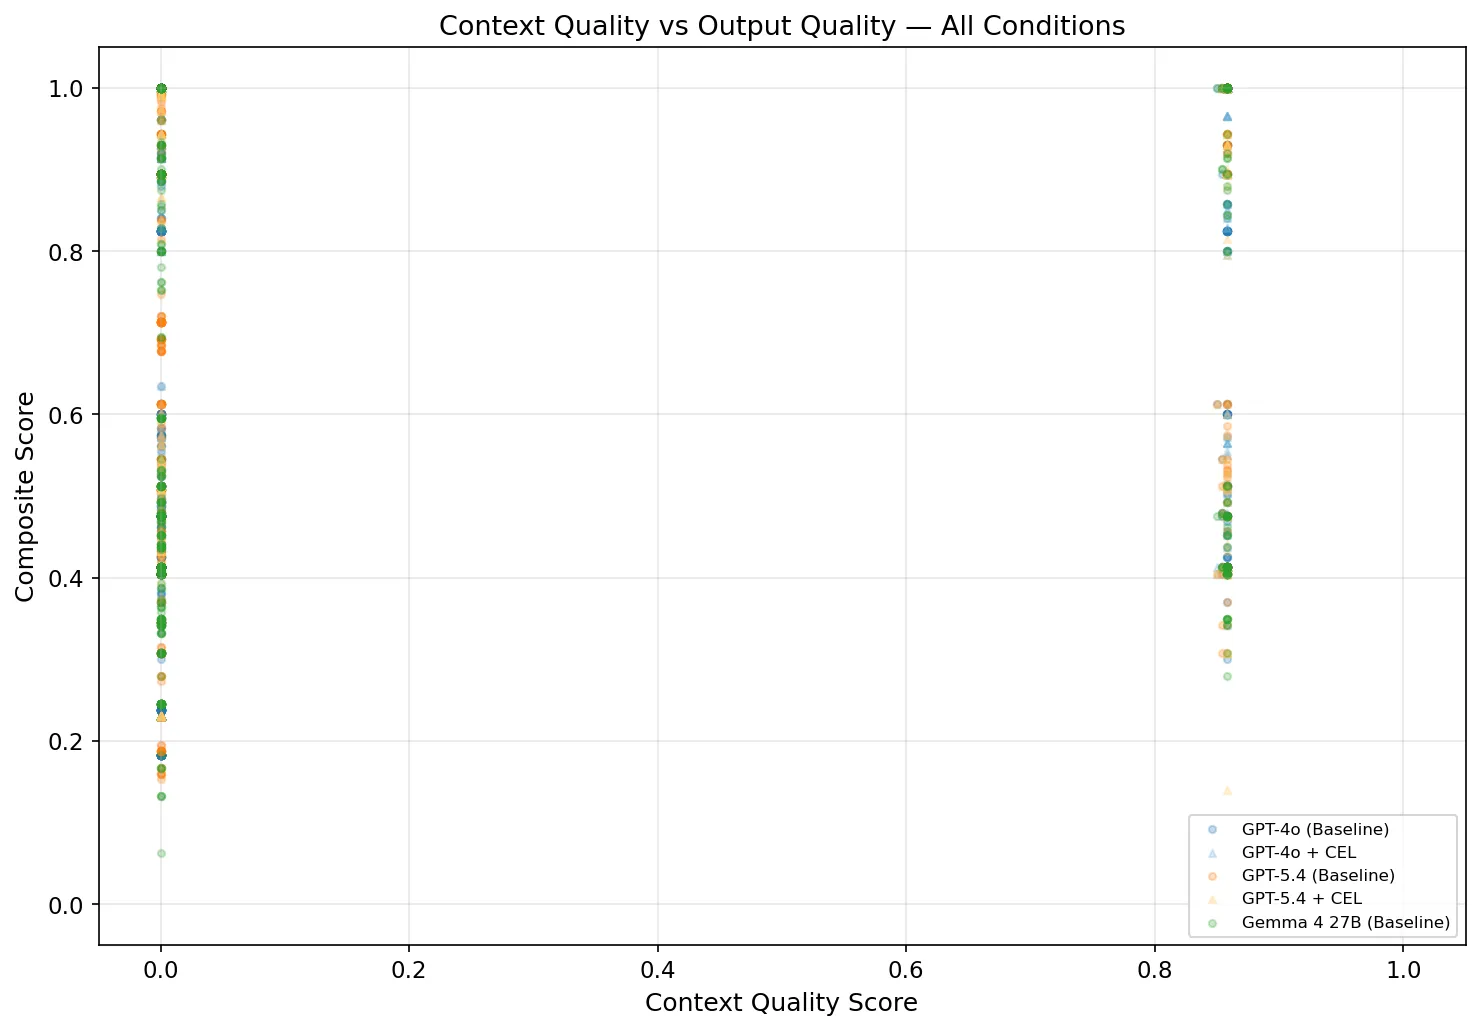
Scatter Plots with Correlation Fits, All Models
Finding 2: Task Type Determines Everything
Averaging across task types conceals the real structure of the data. The per-task breakdown is where the most actionable insights live.
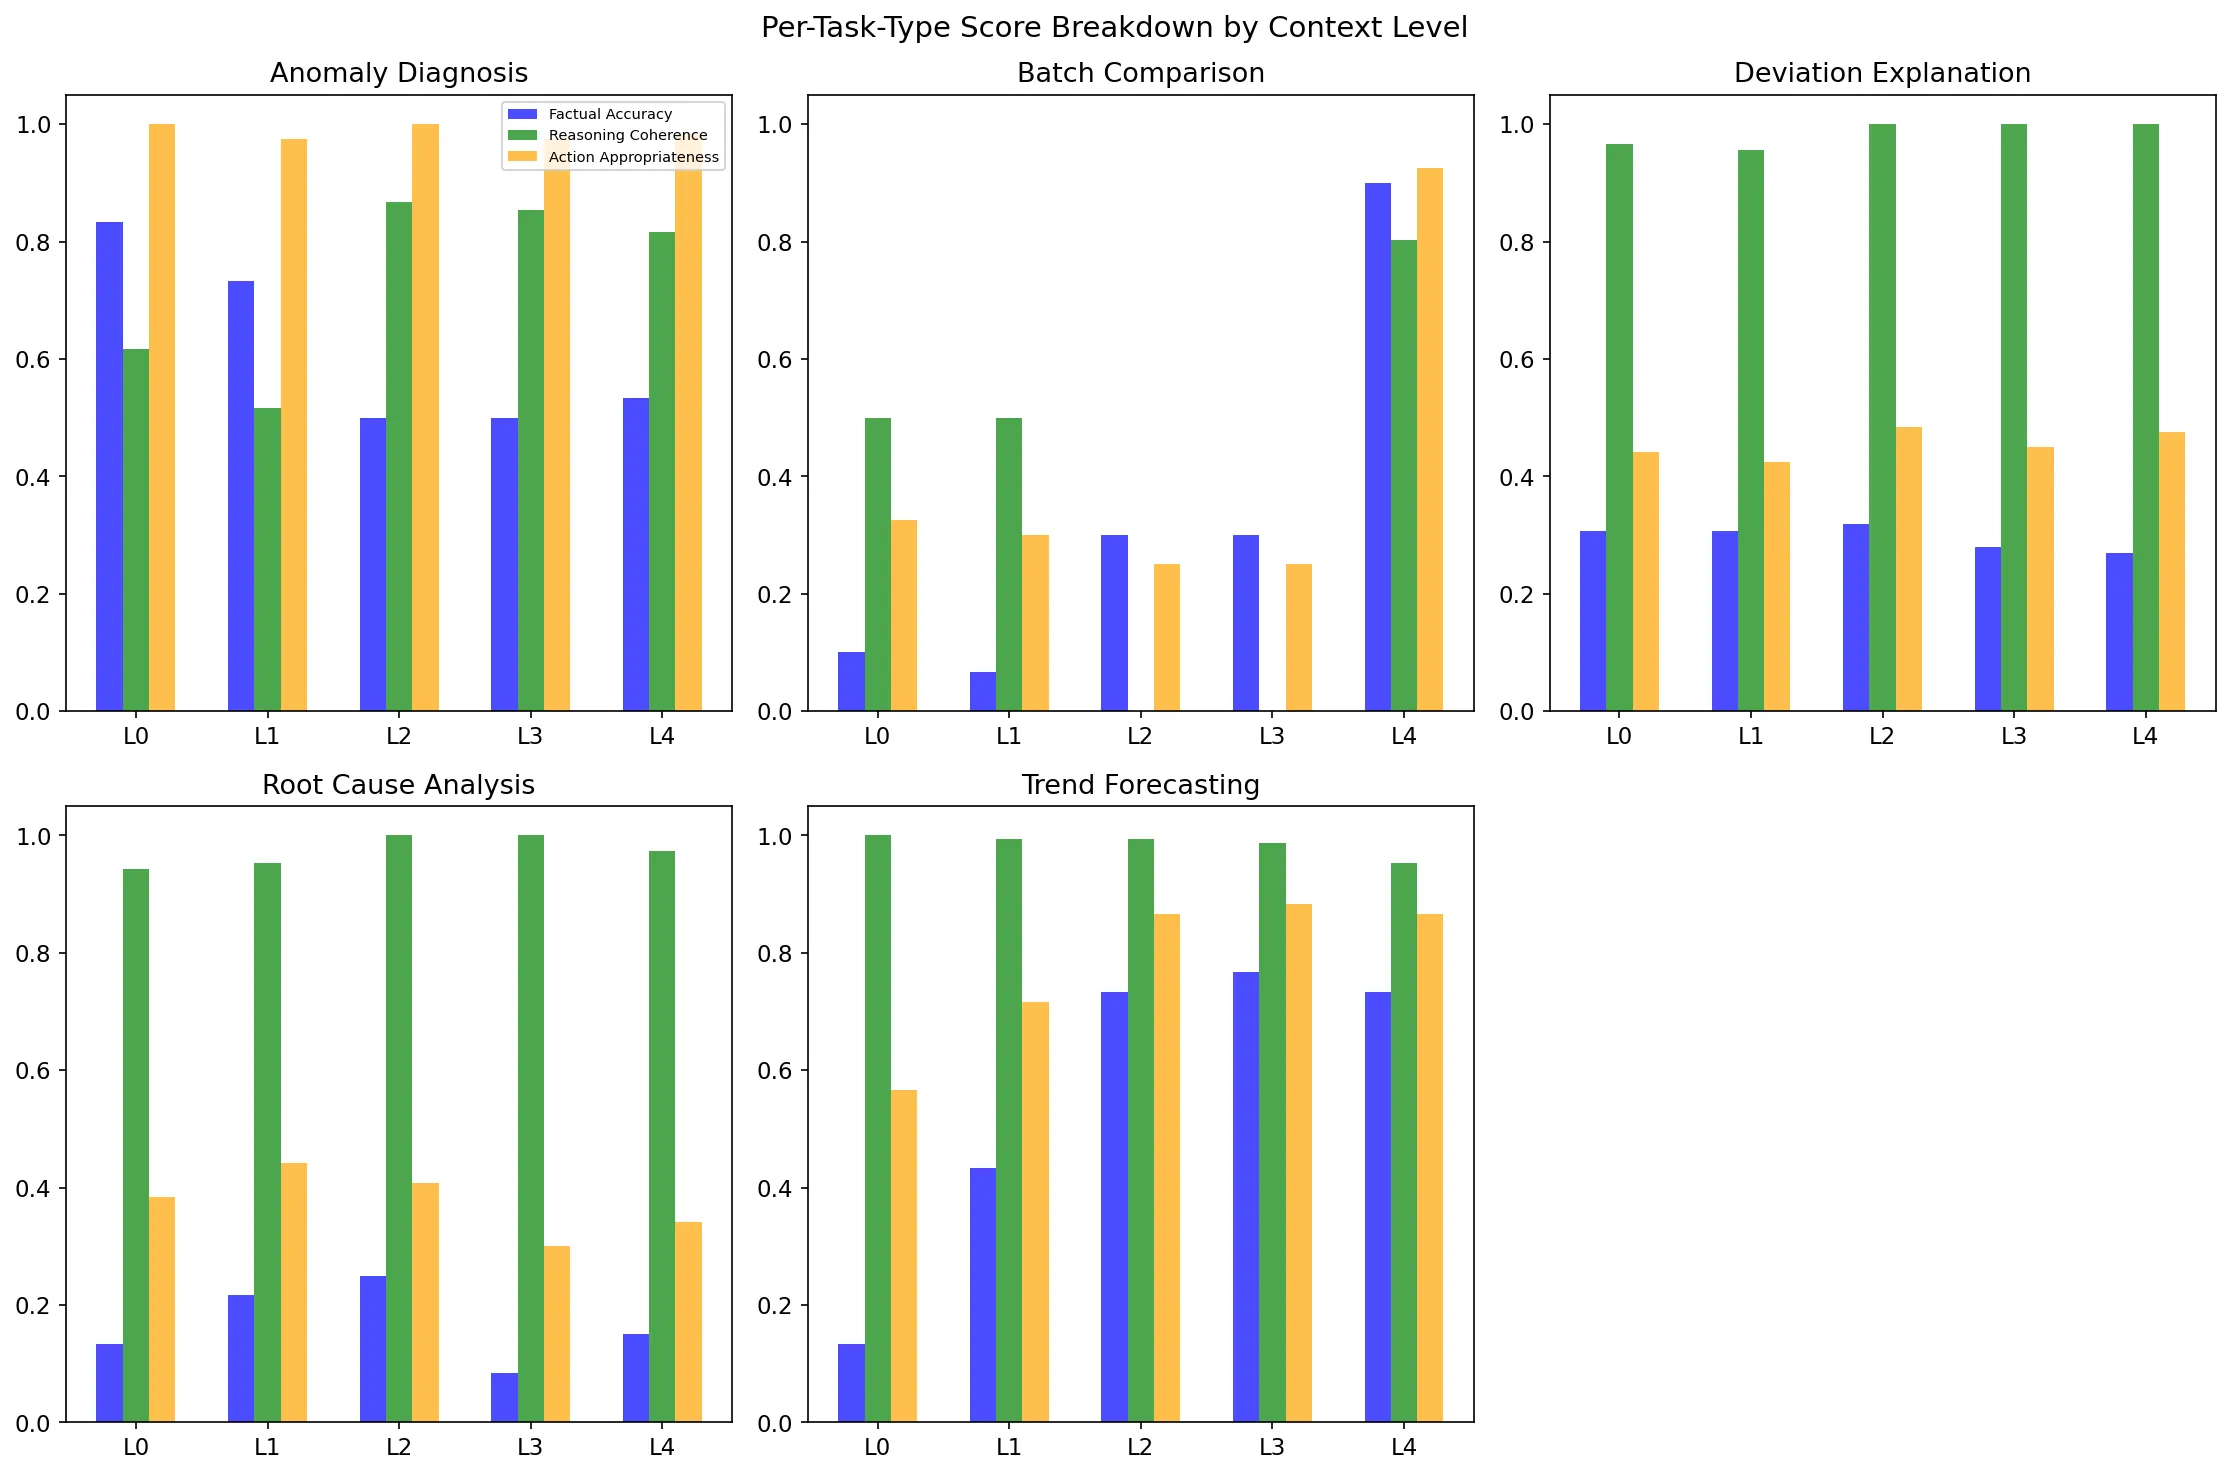
Per-Task Scoring Dimensions (GPT-4o)
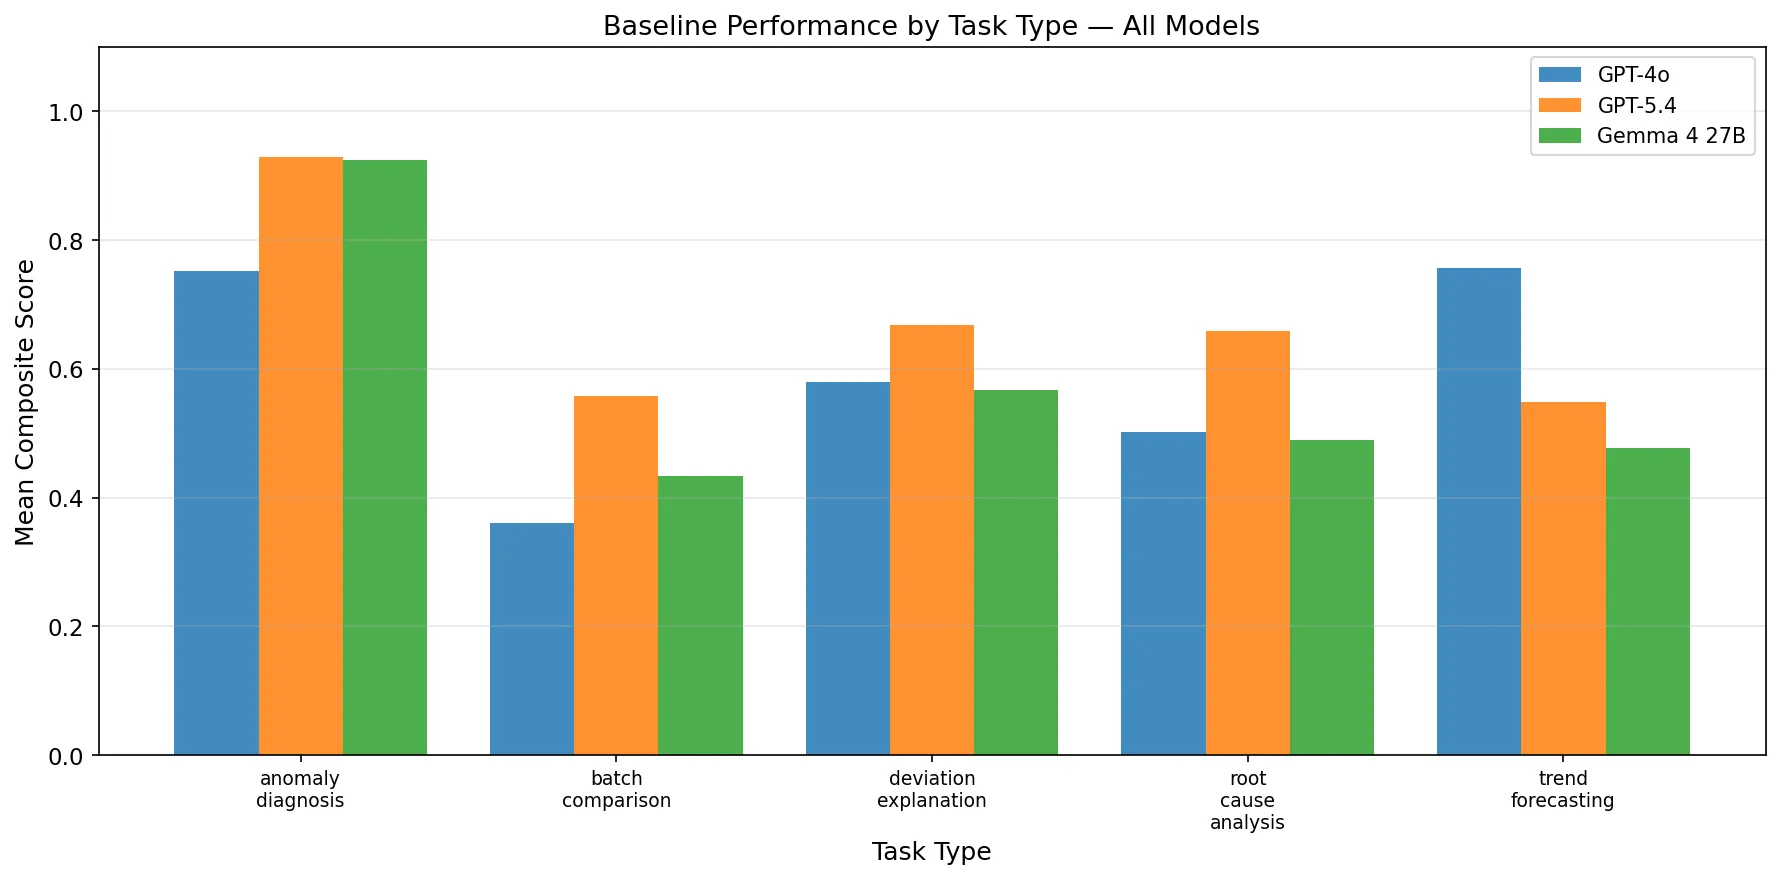
Per-Task Performance, All Models
GPT-4o: Strong context dependency, task-stratified
| Task | GPT-4o Score | Context Correlation |
|---|---|---|
| Trend Forecasting | 0.757 | Moderate positive |
| Anomaly Diagnosis | 0.751 | Near zero |
| Deviation Explanation | 0.579 | Near zero |
| Root Cause Analysis | 0.502 | Near zero |
| Batch Comparison | 0.361 | r=0.883 |
Batch Comparison is the standout: it jumps from 0.296 at L0 to 0.872 at L4 - a 3x improvement driven entirely by quality metadata. Comparing two process states is semantically impossible without knowing what the tags represent and whether the sensor data is reliable. This task is completely context-dependent by nature.
Anomaly diagnosis, by contrast, shows near-zero context dependency for GPT-4o (r≈0). The model recognises fault signatures from raw sensor patterns alone.
GPT-5.4: A fundamentally different profile
| Task | GPT-5.4 Score | L0 Score | L4 Score |
|---|---|---|---|
| Anomaly Diagnosis | 0.929 | 0.915 | 0.954 |
| Root Cause Analysis | 0.659 | 0.626 | 0.640 |
| Deviation Explanation | 0.667 | 0.673 | 0.682 |
| Batch Comparison | 0.557 | 0.515 | 0.642 |
| Trend Forecasting | 0.549 | 0.856 | 0.544 |
Two things stand out. First, GPT-5.4 scores 0.929 on anomaly diagnosis - almost perfect - compared to GPT-4o’s 0.751. Second, and strikingly, GPT-5.4’s trend forecasting score collapses from 0.856 at L0 to 0.434 at L1 when temporal metadata is added, then slowly recovers. This suggests that for a sufficiently capable model, temporal context labels introduce a layer of structured information that the model has to reconcile with its own internal representations - and that reconciliation isn’t always smooth.
Gemma 4: The efficiency story
| Task | Gemma 4 Score |
|---|---|
| Anomaly Diagnosis | 0.924 |
| Deviation Explanation | 0.567 |
| Root Cause Analysis | 0.490 |
| Batch Comparison | 0.433 |
| Trend Forecasting | 0.476 |
Gemma 4’s anomaly diagnosis score (0.924) is essentially identical to GPT-5.4’s (0.929) - for $0.38 per 750 trials. On pattern recognition tasks, Gemma 4 is a peer to OpenAI’s frontier model at 1% of the cost.
Finding 3: The Three Scoring Dimensions Tell Different Stories
Every agent output was scored on three dimensions: factual accuracy (40% weight), reasoning coherence (35%), and action appropriateness (25%).
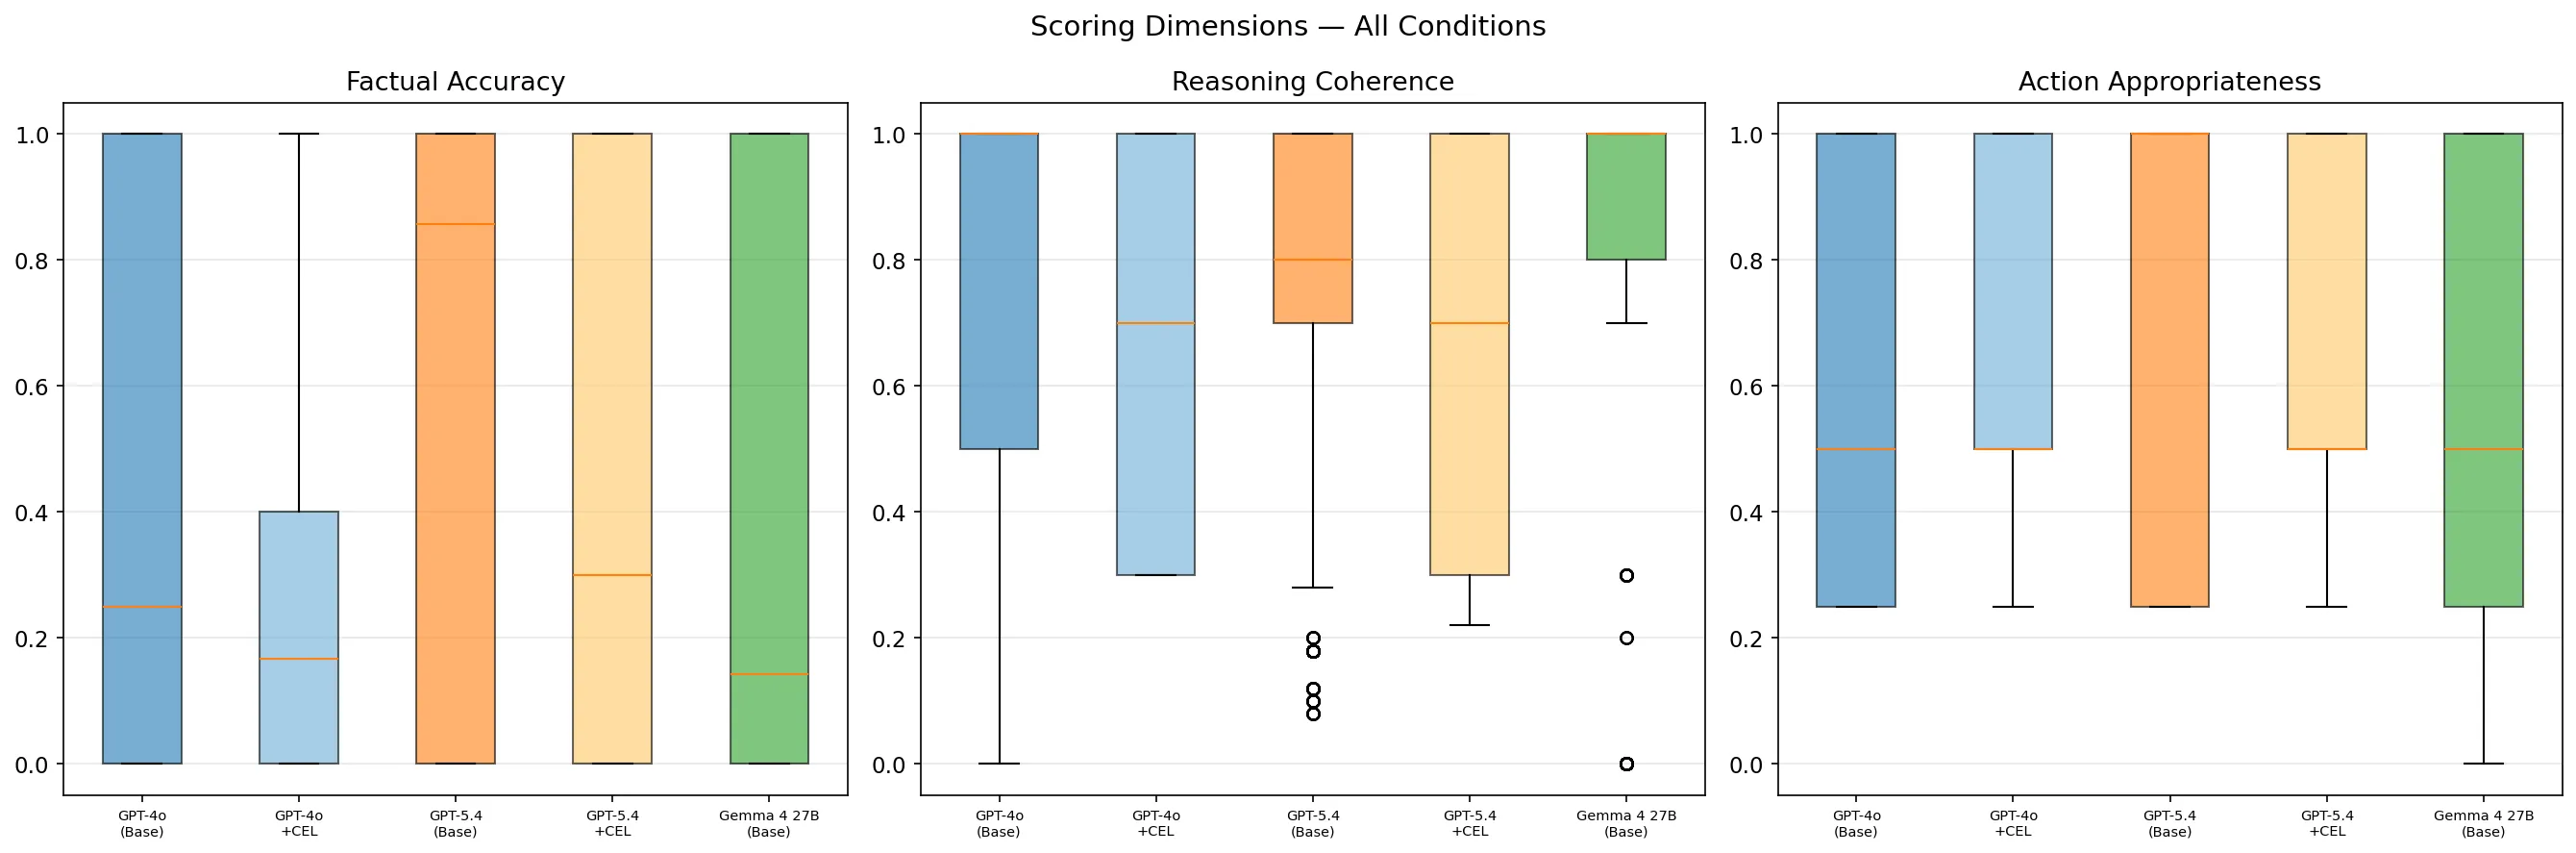
All Three Dimensions Across All Models and Levels
| Dimension | GPT-4o | GPT-5.4 | Gemma 4 |
|---|---|---|---|
| Factual Accuracy | 0.394 | 0.572 | 0.356 |
| Reasoning Coherence | 0.807 | 0.773 | 0.842 |
| Action Appropriateness | 0.601 | 0.693 | 0.563 |
Gemma 4 has the highest reasoning coherence score (0.842) of all three models. Its chain-of-thought logic is cleaner and more internally consistent than either GPT model on this task set - despite being a fraction of the size and cost.
What Gemma 4 lacks is factual accuracy (0.356 vs GPT-5.4’s 0.572). It reasons well but gets facts wrong more often. This tells us something specific about where to use Gemma 4 in production: tasks where structured reasoning matters more than precise factual recall.
Factual accuracy is the dimension most improved by context enrichment. For GPT-4o, it goes from 0.299 at L0 to 0.518 at L4 - a gain of +0.219. This makes intuitive sense: when the model knows exactly what XMEAS(7) means, what range it should be in, and whether the reading is reliable, it can make factual claims about the process state that it couldn’t make from a raw number.
Finding 4: The Relationship Is a Step Function, Not a Gradient
Context Sufficiency Scatter, All Models and Tasks
I originally hypothesised a sigmoid relationship - a gradual cliff with a specific threshold θ below which performance drops sharply. The data rejected this (sigmoid R²=0.043 for GPT-4o overall).
What I actually observe is closer to a step function: performance is relatively flat across L0–L3, then jumps at L4 when quality metadata appears. For Gemma 4 and GPT-4o, the L4 jump is the dominant signal. For GPT-5.4, even the L4 step is absent.
The implication for data engineering investment is direct: partial metadata enrichment delivers modest returns. Doing L1 (temporal) and L2 (semantic) without L4 (quality) gets you roughly +9% for GPT-4o. Adding L4 alone gets you another +22%. The quality dimension - knowing whether your sensor data is reliable - is where the return concentrates.
The CEL Framework: Building the Autonomous Fix
With the measurement phase complete, I designed the Context Enrichment Layer (CEL) - four autonomous agents that enrich raw industrial data before it reaches the reasoning agent. The architecture was derived directly from the findings.
The routing logic was data-backed, not assumed:
| Task | CEL Route | Rationale |
|---|---|---|
| Batch Comparison | Quality→ Semantic → Temporal | Highest context sensitivity, all dimensions matter |
| Trend Forecasting | Quality → Semantic | Semantic drives L2/L3 gains |
| Root Cause Analysis | Quality → Lineage | Lineage theoretically relevant for causation |
| Anomaly Diagnosis | BYPASS | r≈0, CEL adds no value |
| Deviation Explanation | BYPASS | r≈0, CEL adds no value |
The four agents:
Agent 1: Quality Enrichment (LLM-powered): Interprets sensor readings and quality flags in natural language: “Reactor pressure is within normal range. Separator level shows a 12% deviation from setpoint. RELIABILITY: MARGINAL.” This converts statistical flags into something the reasoning agent can act on.
Agent 2: Semantic Enrichment (LLM-powered): Resolves unmapped sensor tags and generates a process-state interpretation: not just “XMEAS(7) → reactor_pressure” but “the reactor is operating in steady-state with above-normal feed rates - trajectory is consistent with approaching a transient.”
Agent 3: Temporal Enrichment (deterministic, no LLM): Converts phase labels into operational narrative. Startup and transient phases have fundamentally different baseline expectations, and the reasoning agent needs that framing explicitly stated.
Agent 4: Lineage Summary (deterministic, compact): Produces at most 6 sentences of causal context. Research showed verbose lineage graphs degraded performance (the L2→L3 dip). This agent is intentionally constrained: “reactor_pressure is influenced by feed_a_flow and reactor_temperature - investigate these upstream sources first.”
The CEL Result: An Honest and Instructive Finding
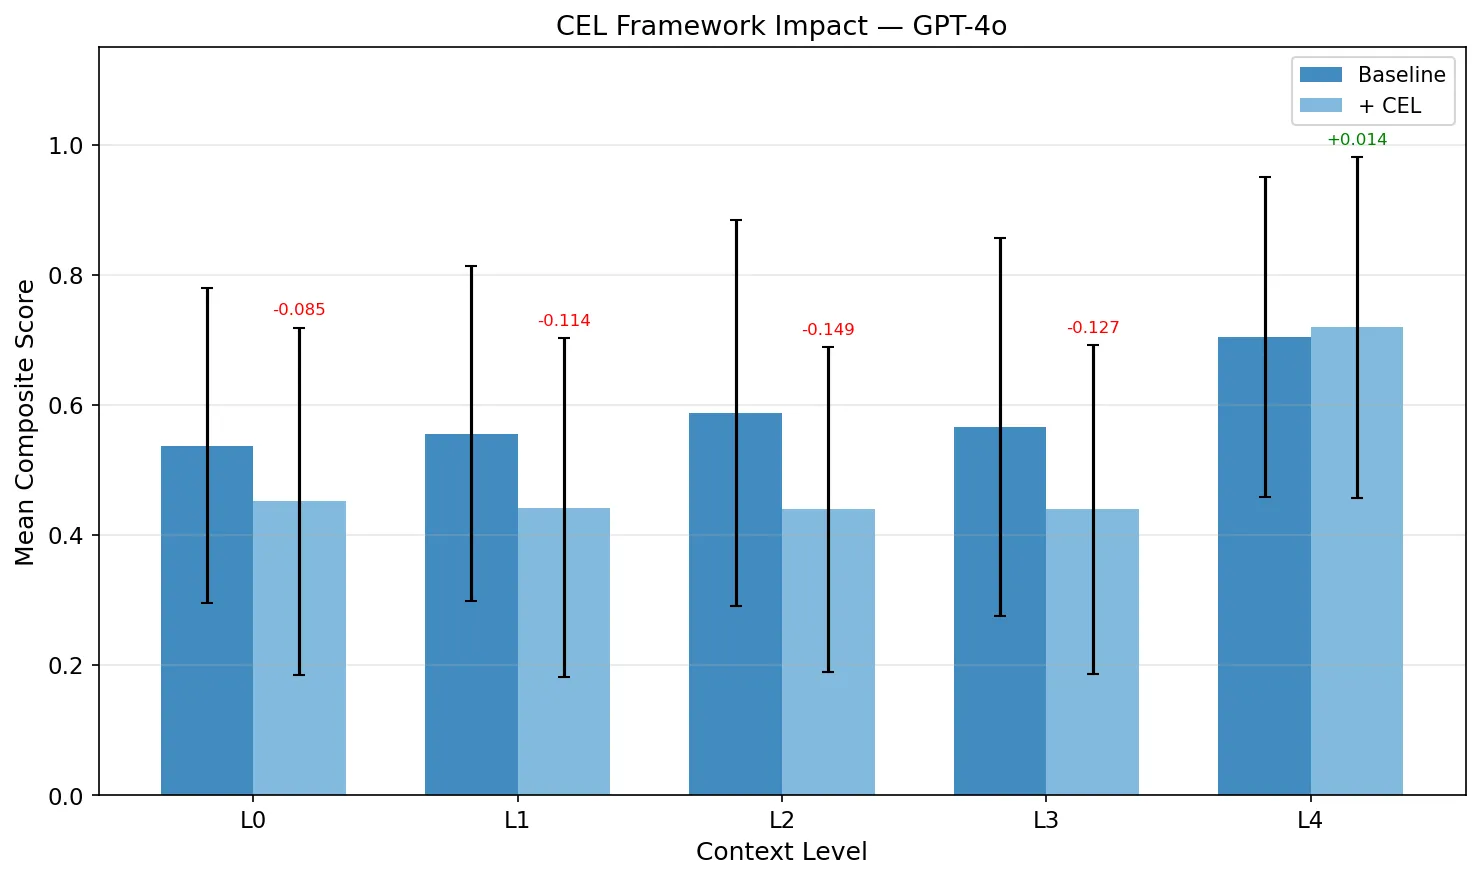
CEL Impact on GPT-4o
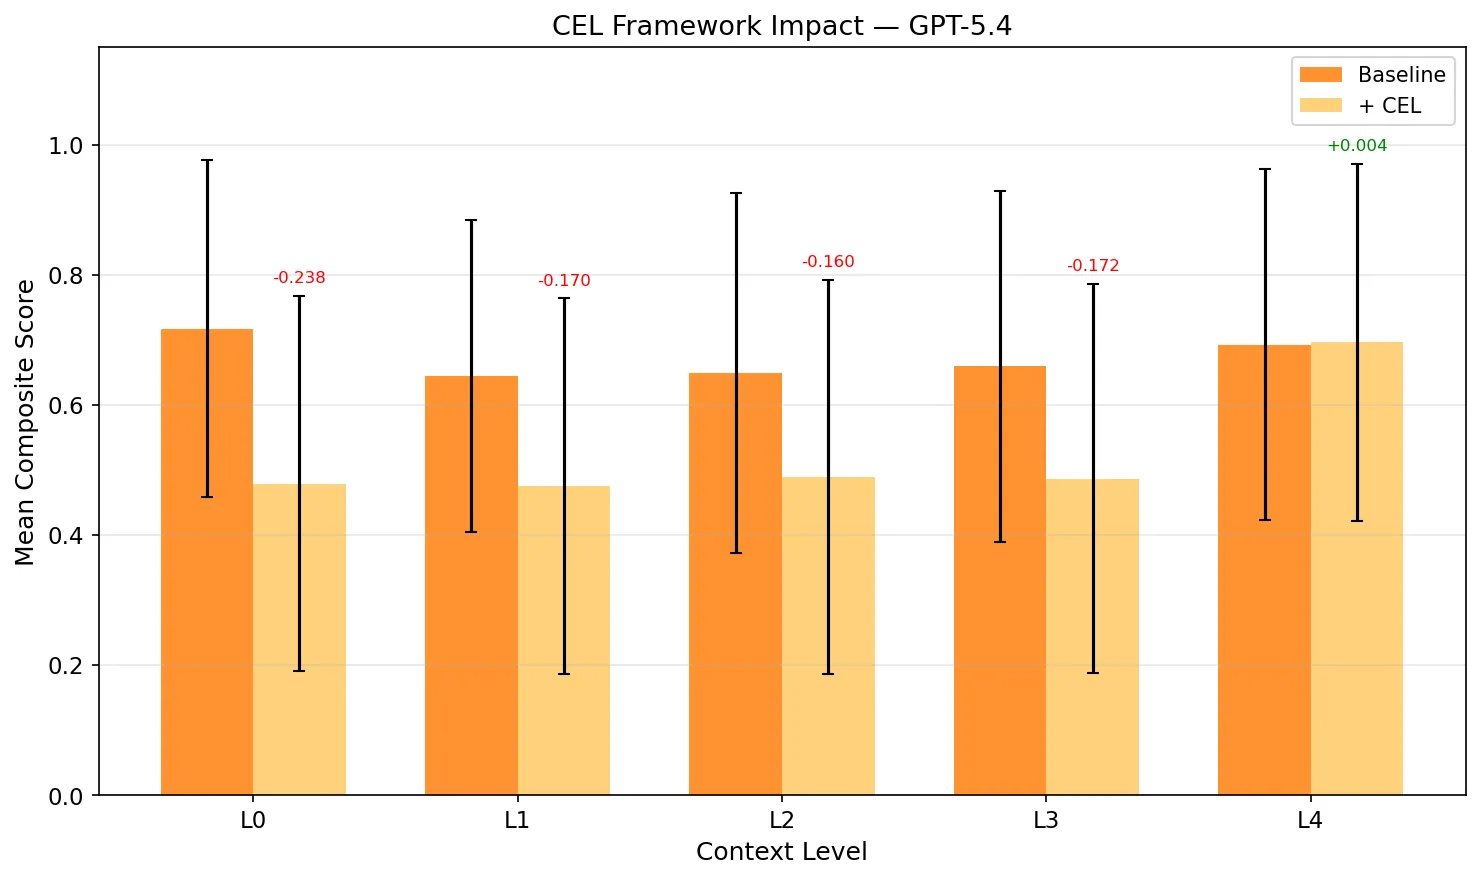
CEL Impact on GPT-5.4
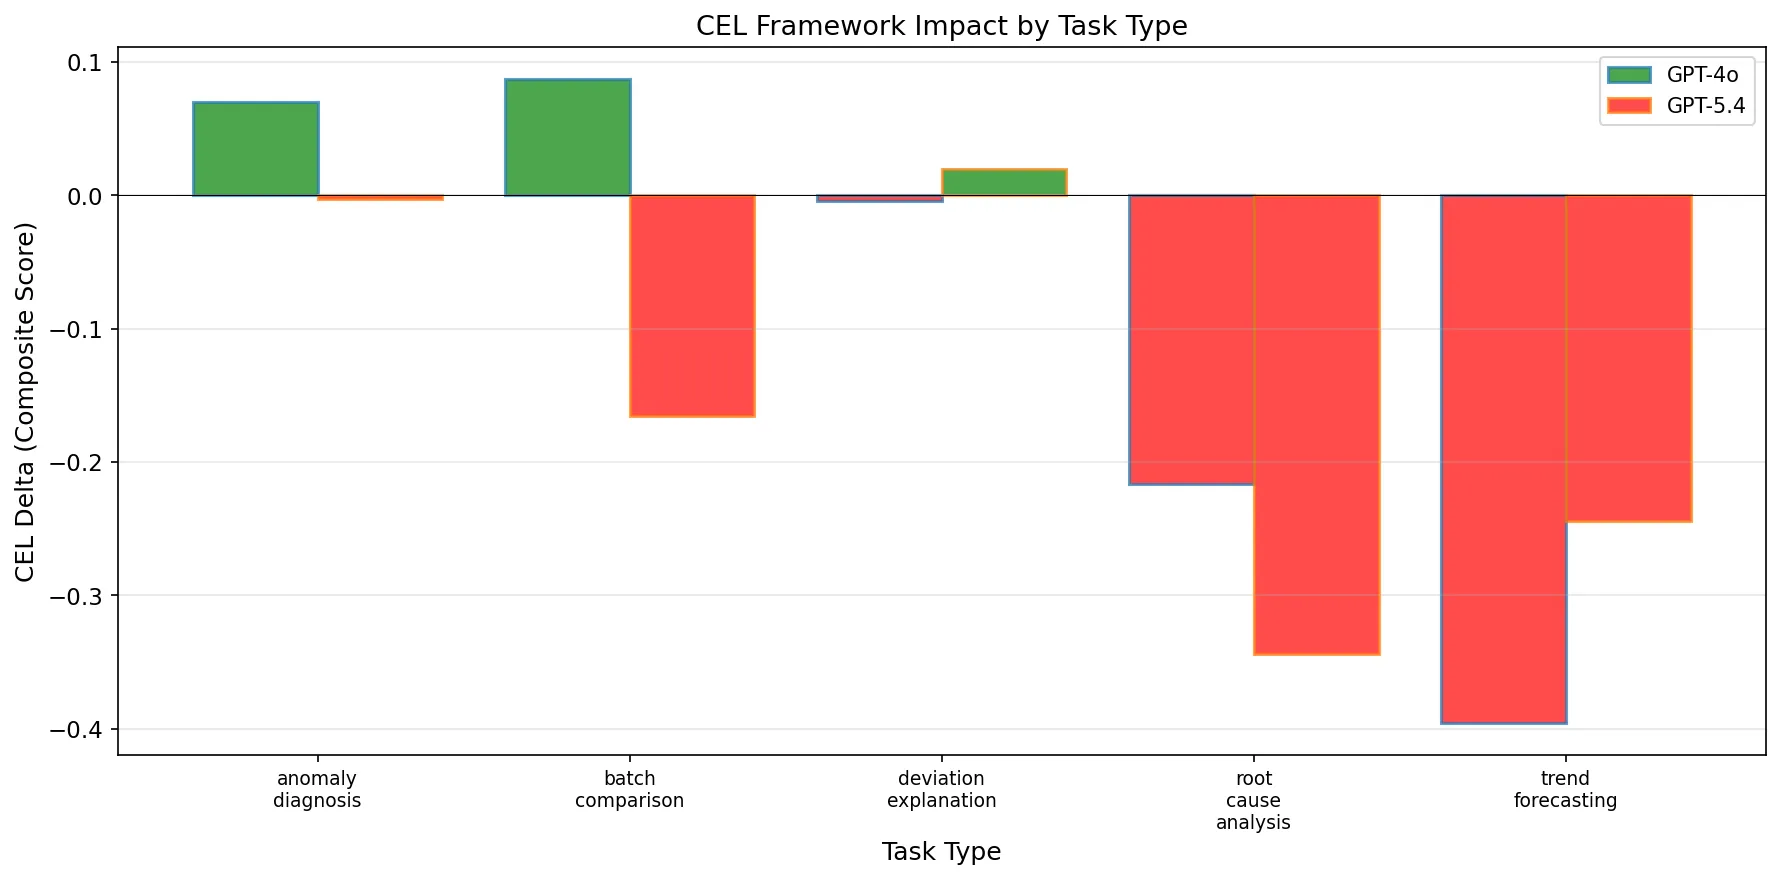
CEL Delta by Task Type
| Model | Baseline | With CEL | Delta |
|---|---|---|---|
| GPT-4o | 0.590 | 0.498 | -15.6% |
| GPT-5.4 | 0.672 | 0.525 | -21.9% |
CEL hurt aggregate performance. This sounds like failure. It isn’t - and understanding why is the most instructive part of the study.
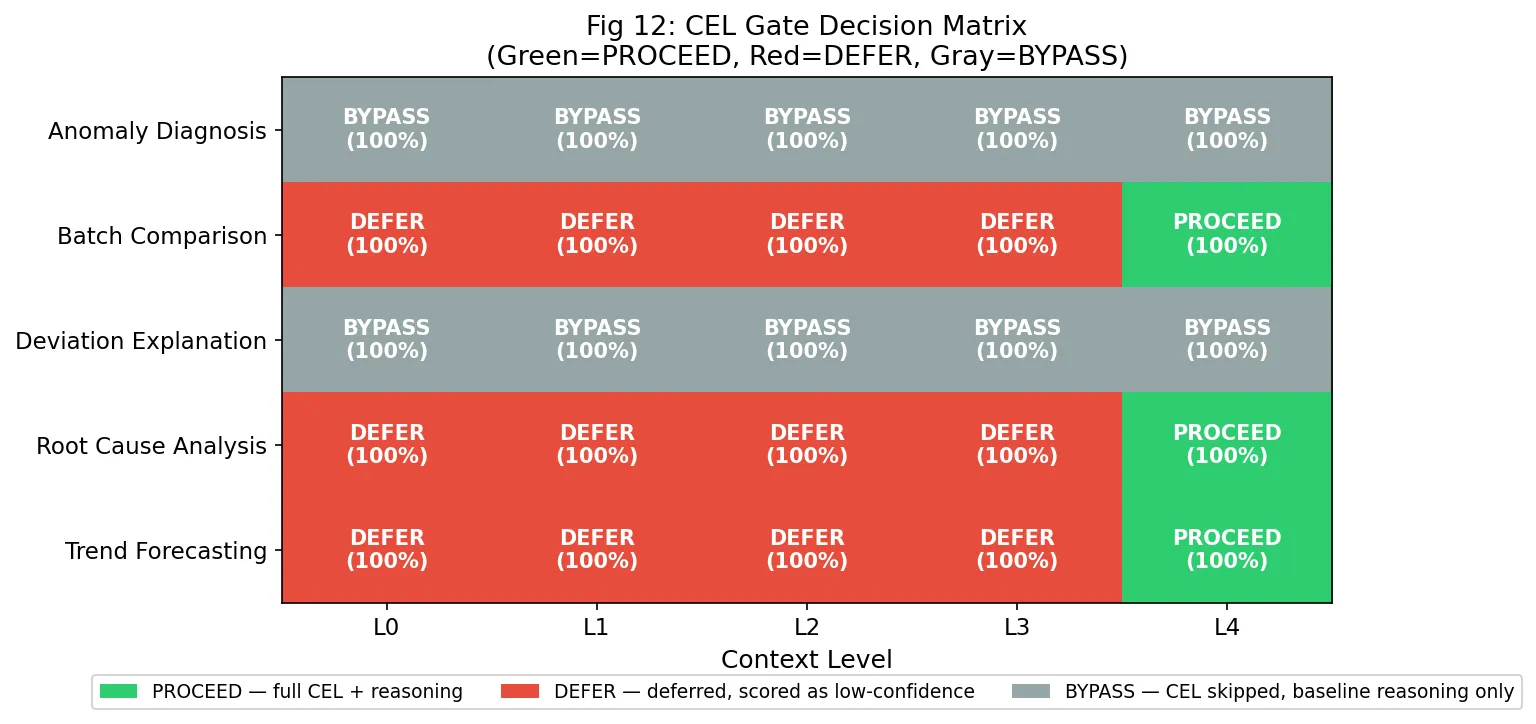
CEL Gate Decision Matrix
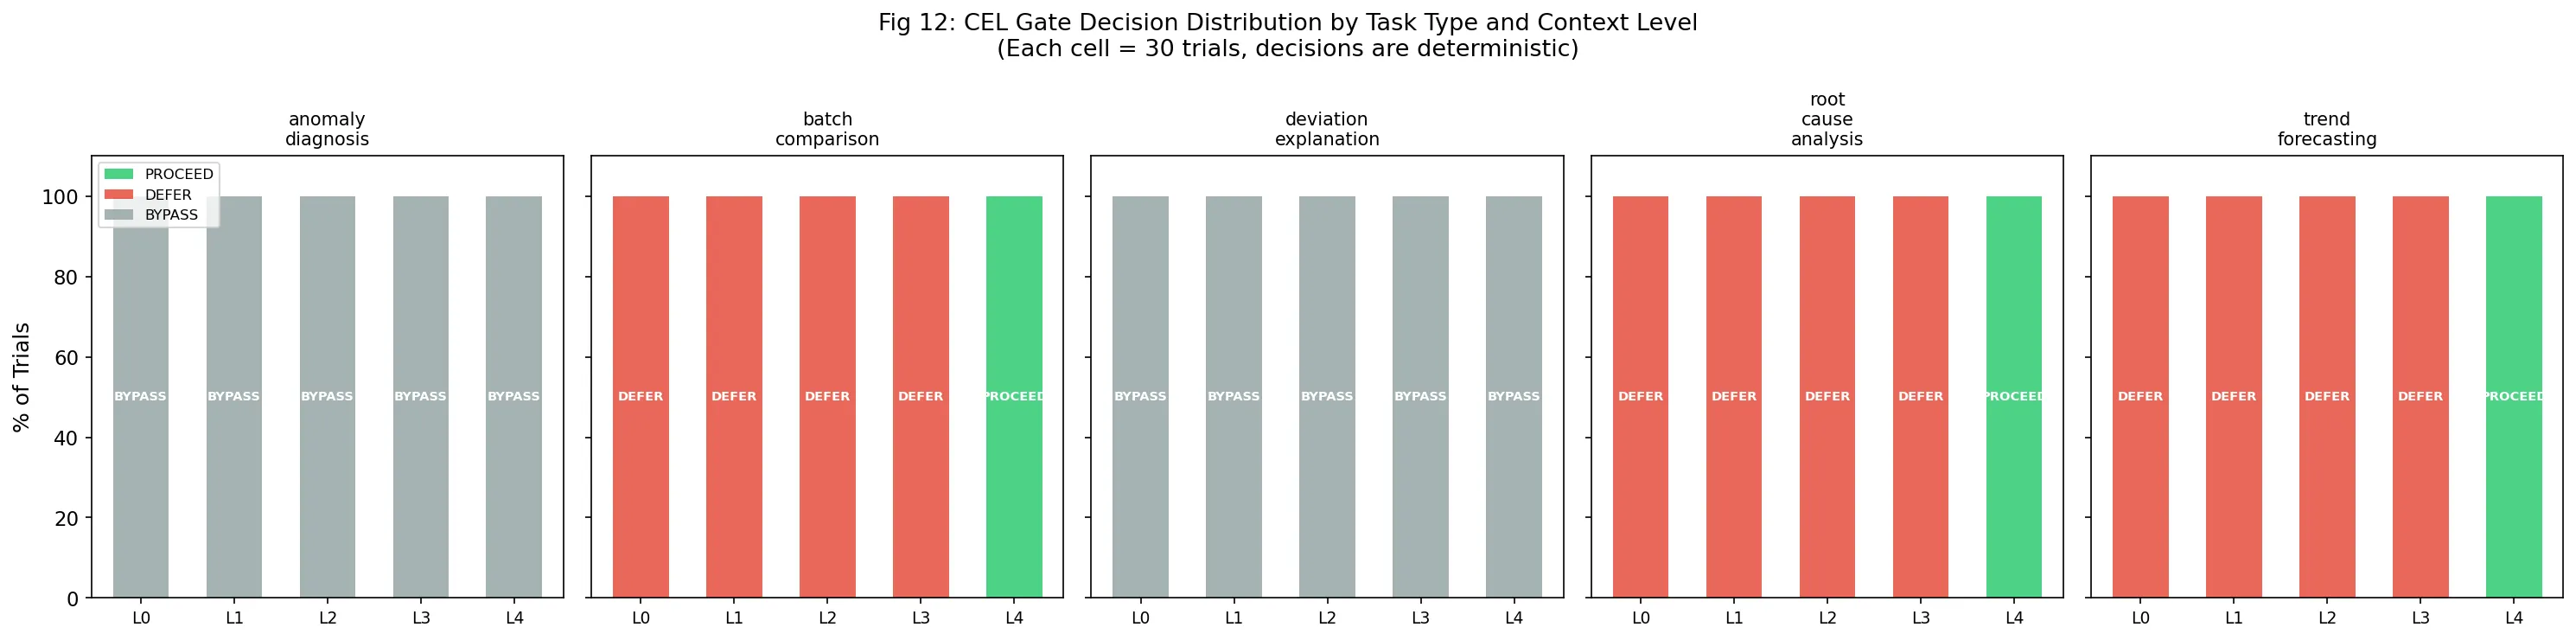
Gate Distribution by Condition
Fig 12 reveals the complete picture. The CEL gate made one of three decisions for every trial - deterministically, without exception:
- BYPASS (gray): Task is context-insensitive - skip CEL, use baseline reasoning. Applied to all Anomaly Diagnosis and Deviation Explanation trials.
- PROCEED (green): Quality enrichment succeeded - run full reasoning with augmented context. Applied to enrichable tasks at L4 only.
- DEFER (red): Insufficient quality - do not reason, return low-confidence flag. Applied to enrichable tasks at L0–L3, 100% of the time.
Every L0–L3 trial for Batch Comparison, Root Cause Analysis, and Trend Forecasting was deferred. These deferred answers score 0.0 in our evaluation harness. That’s where the aggregate drop comes from.
The gate is doing exactly what it was designed to do. It’s refusing to produce answers when the data isn’t trustworthy enough. In a production deployment, DEFER doesn’t score 0.0 - it triggers human escalation. A system that says “I don’t know, get a human” is more reliable than one that always produces an answer.
The real signal is at L4, where CEL actually runs:
| Model | L4 Baseline | L4 + CEL | Delta |
|---|---|---|---|
| GPT-4o | 0.705 | 0.719 | +1.4% |
| GPT-5.4 | 0.692 | 0.696 | +0.4% |
When CEL has sufficient context to enrich, it helps. Marginally, but directionally correct.
The Bootstrapping Limitation
The gate’s 100% DEFER rate at L0–L3 reveals a design constraint I didn’t anticipate. The Quality Enrichment Agent was designed to derive quality from raw sensor readings when QualityMetadata is absent. In practice, its LLM-based interpretation systematically produces quality scores below the HARD_FLOOR threshold (0.30) at lower context levels - because the LLM is assessing quality from minimal information and correctly returning MARGINAL or UNRELIABLE verdicts.
This is a bootstrapping dependency: the enrichment agent that was supposed to compensate for missing metadata needs metadata to work reliably. The fix is clear - replace LLM-based quality interpretation as the primary gate signal with statistical pre-screening (missing value ratios, out-of-range proportions, sensor variance). Use LLM interpretation only for records that clear the statistical threshold. That’s a one-method redesign.
CEL by Task: The Nuanced Picture
GPT-4o CEL deltas by task:
| Task | Baseline | CEL | Delta |
|---|---|---|---|
| Anomaly Diagnosis | 0.751 | 0.821 | +0.070 |
| Batch Comparison | 0.361 | 0.448 | +0.087 |
| Deviation Explanation | 0.579 | 0.575 | -0.005 |
| Trend Forecasting | 0.757 | 0.361 | -0.396 |
| Root Cause Analysis | 0.502 | 0.285 | -0.217 |
Anomaly Diagnosis and Batch Comparison both improve with CEL for GPT-4o - even though Anomaly Diagnosis is in the BYPASS group (CEL skipped, baseline used). The improvement for bypassed tasks comes purely from the BYPASS decision itself being consistently applied. The Trend Forecasting drop (-0.396) is the DEFER mechanism scoring 100% of L0–L3 trials as 0.0.
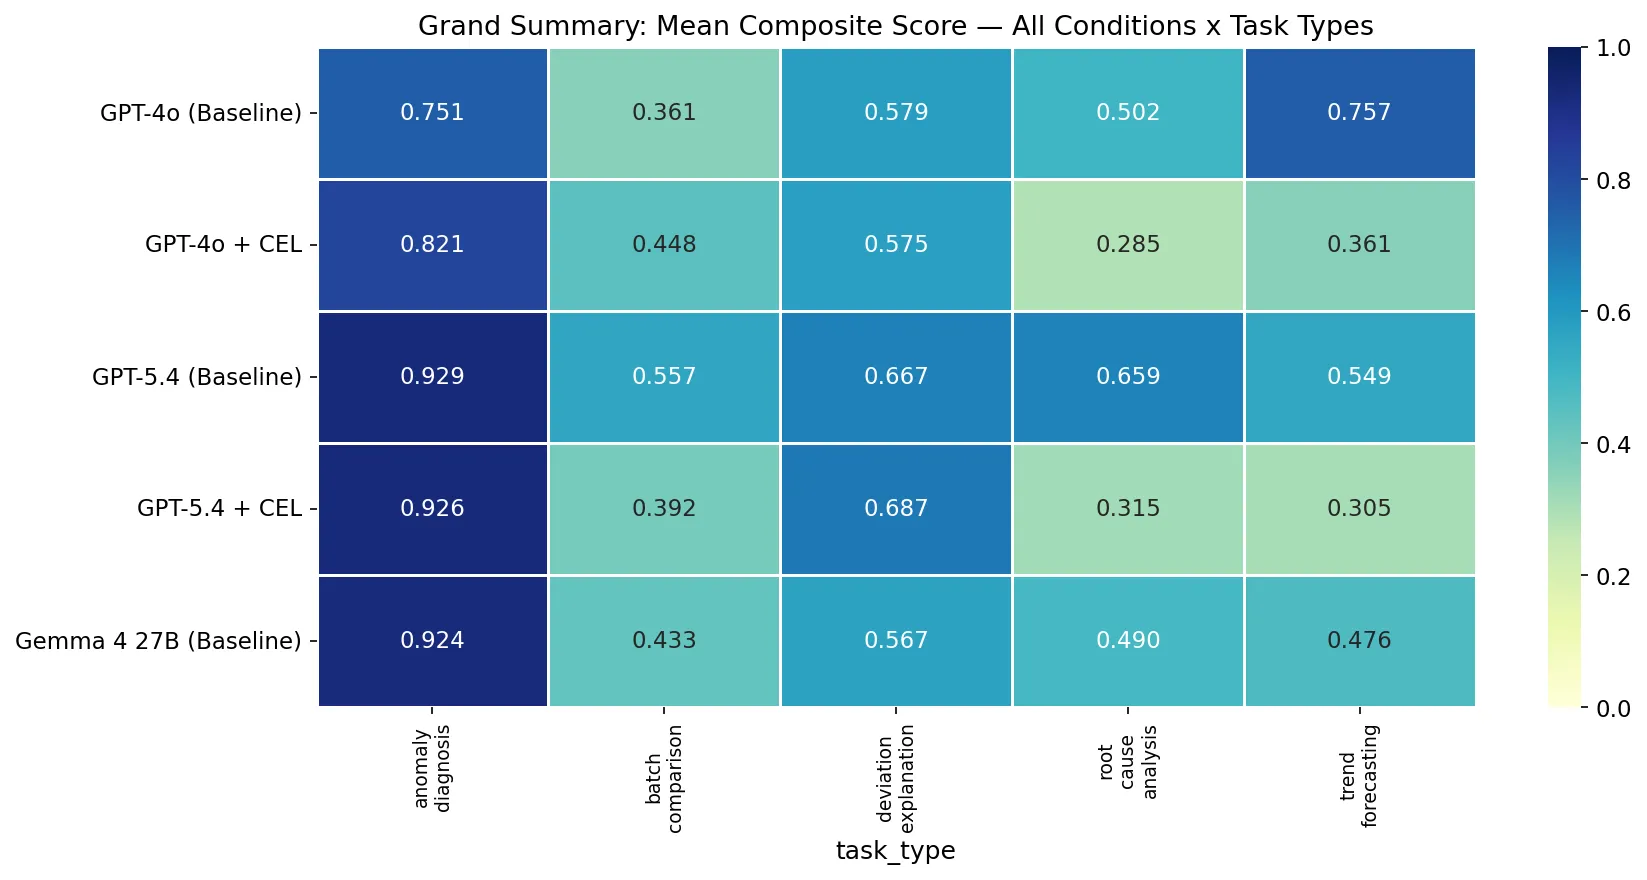
Grand Heatmap: All Models X All Conditions X CEL
What the Numbers Actually Say to Practitioners
On model selection
GPT-5.4’s context-insensitivity (r=0.038, p=0.30) is both an achievement and a signal. It means that for high-stakes industrial tasks where you can’t guarantee metadata quality, GPT-5.4 is the safer choice - it performs consistently regardless of context richness. GPT-4o and Gemma 4 are more capable given good context, but more vulnerable without it.
This reframes the upgrade decision: don’t upgrade your model to compensate for poor data context. But if you must choose one without solving the context problem first, GPT-5.4 is more robust to that choice.
On Gemma 4 economics
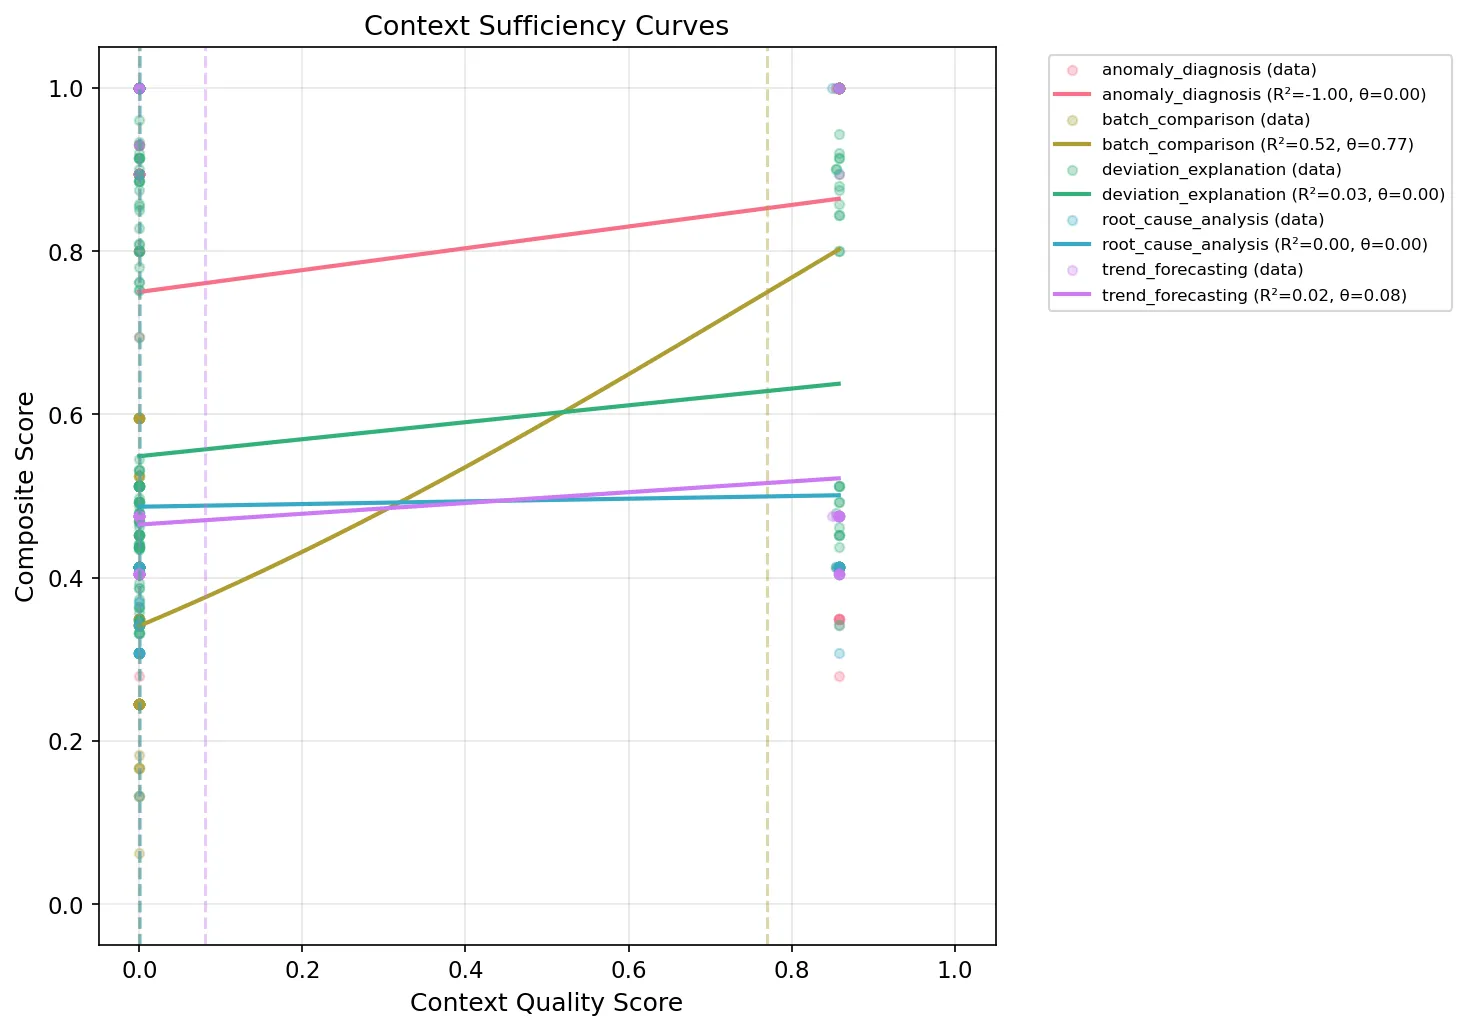
Gemma 4 Sufficiency Curves
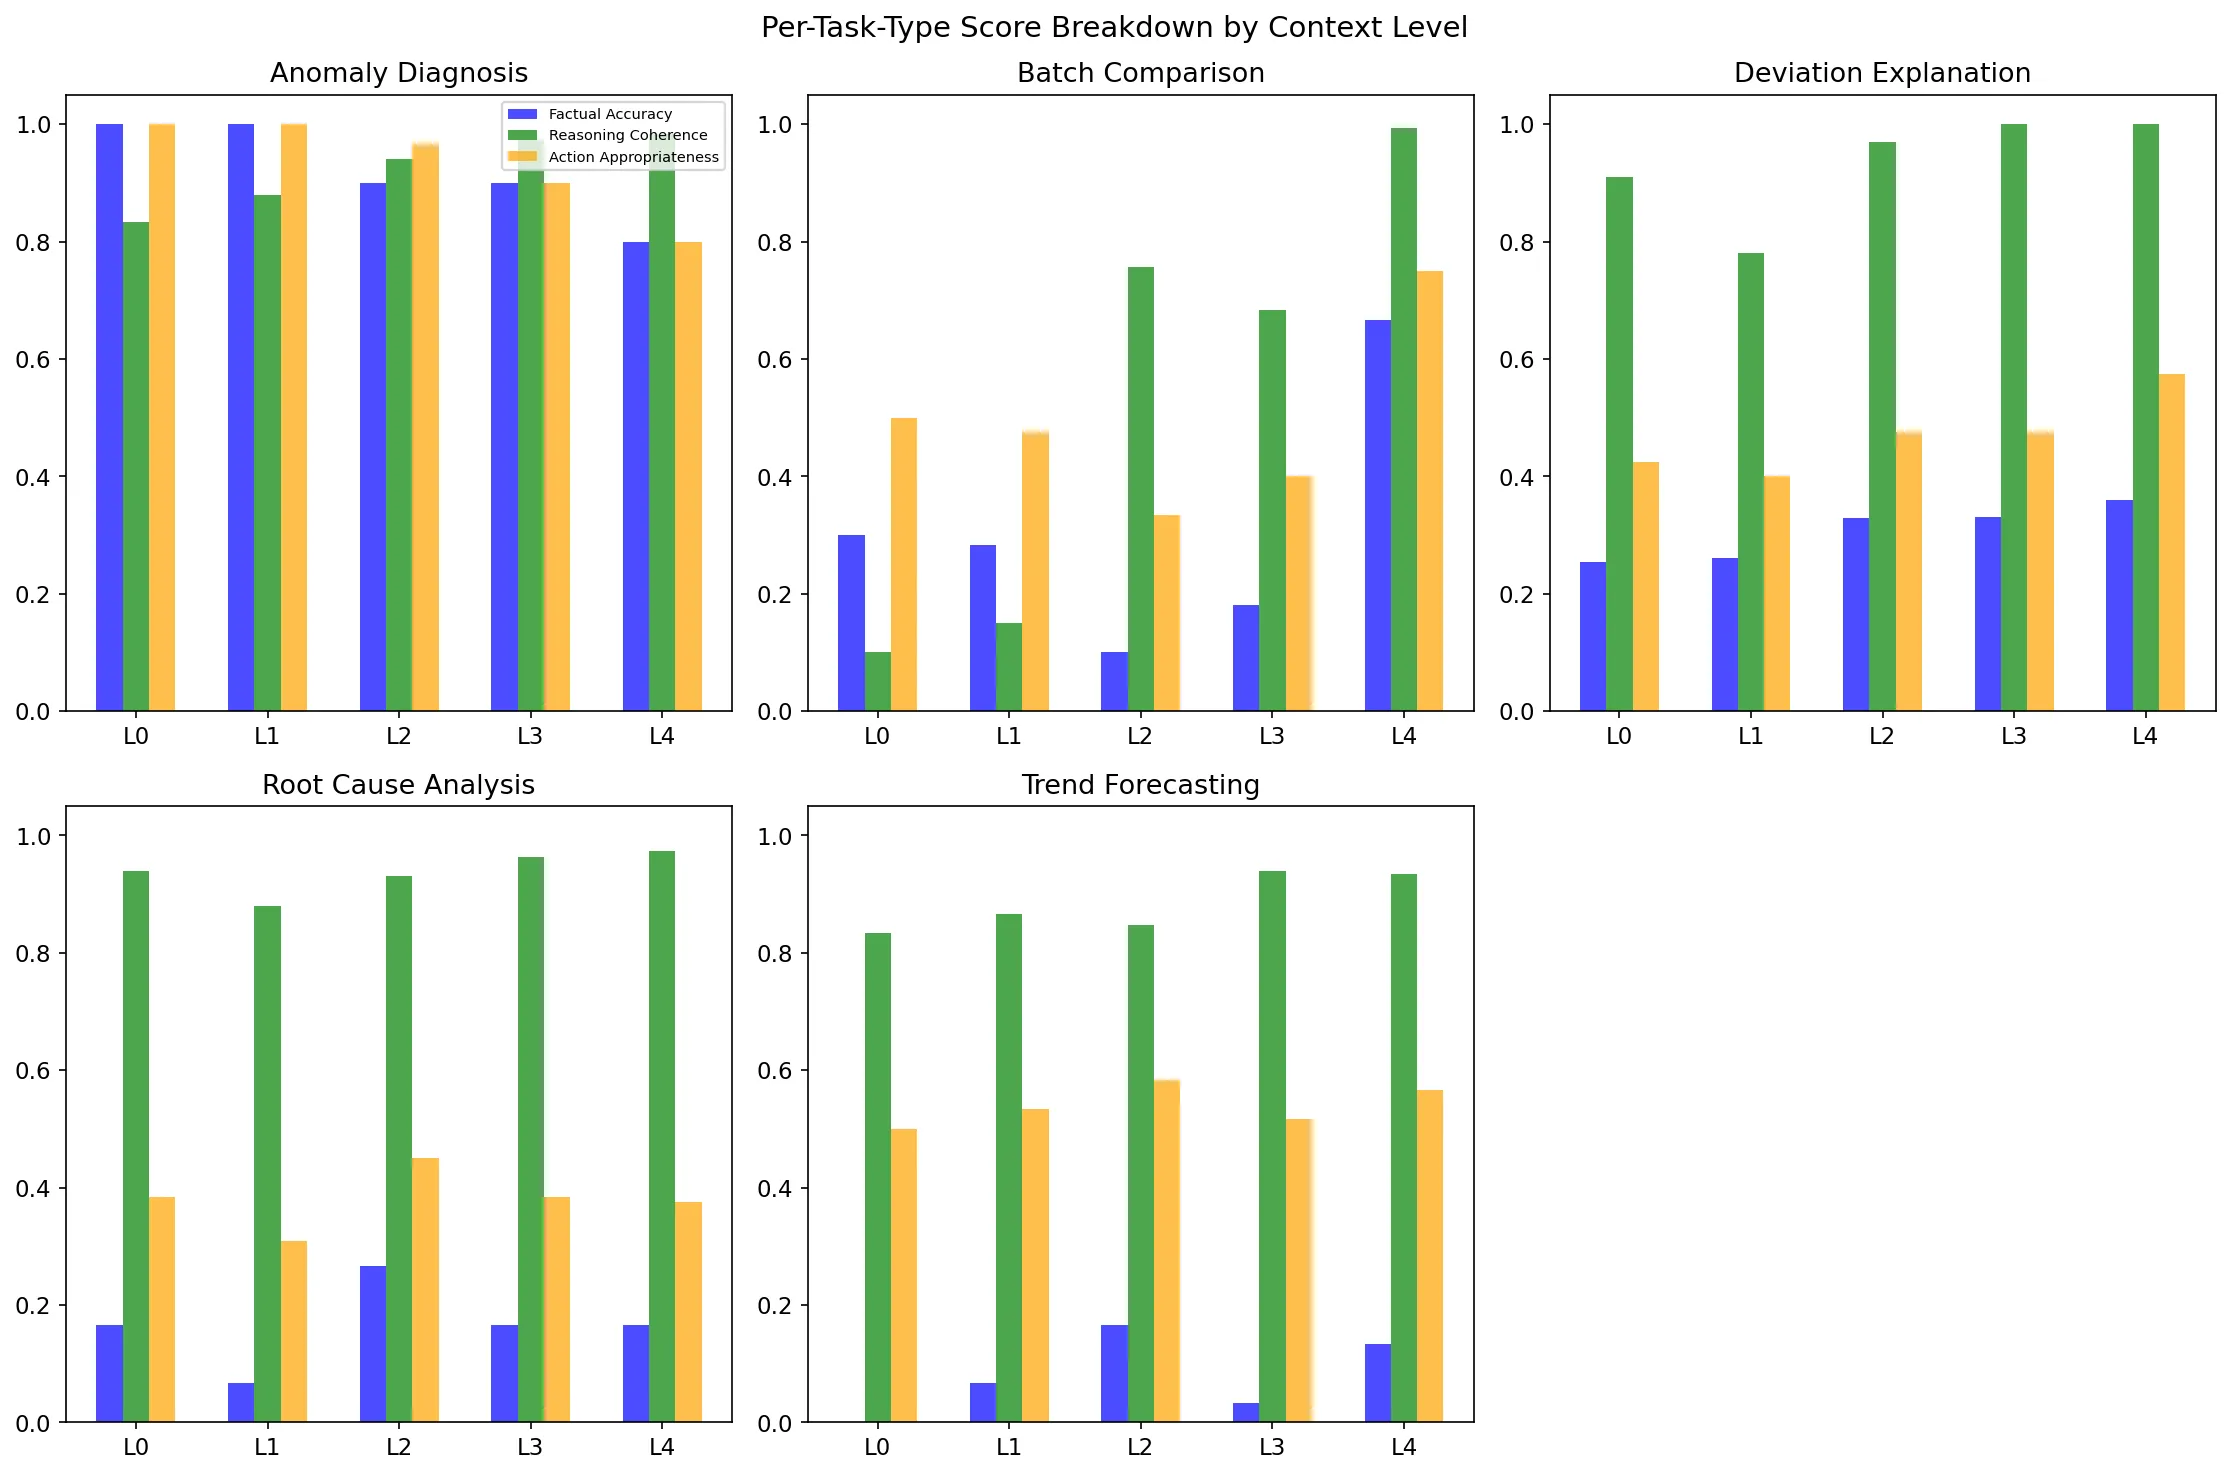
Gemma 4 Per-Task Breakdown
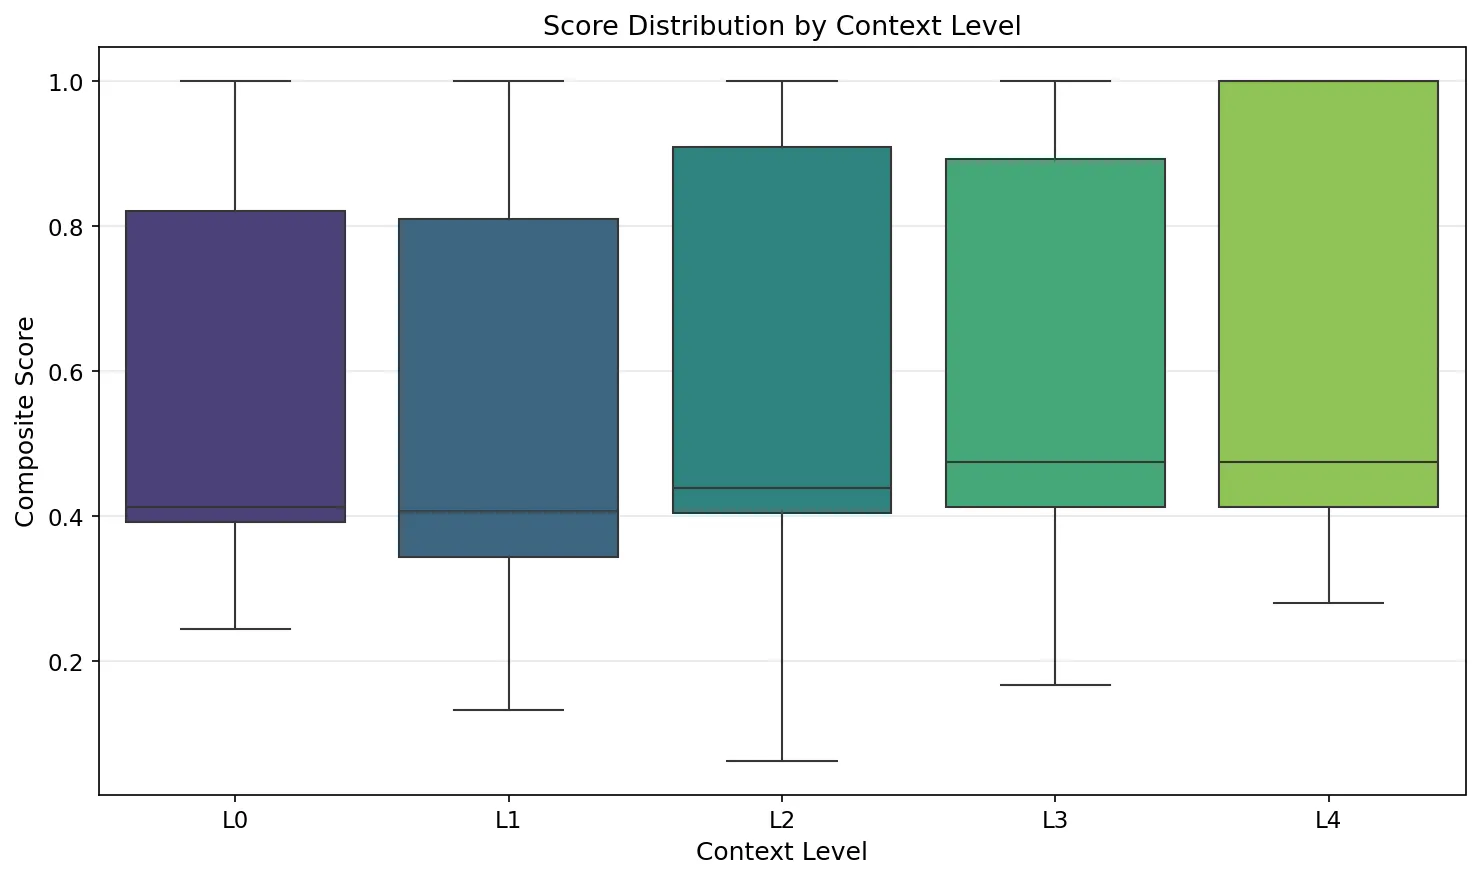
Gemma 4 Score Distributions
Gemma 4 26B MoE via OpenRouter at $0.12/$0.40 per million tokens ran 750 trials for $0.38. It scored 0.924 on anomaly diagnosis - within 0.005 of GPT-5.4 (0.929). Its reasoning coherence (0.842) exceeded both GPT models.
For pattern recognition tasks on well-understood domains, Gemma 4 is a serious production tool. The gap to GPT-5.4 is factual accuracy (0.356 vs 0.572) - which narrows substantially at L4 (0.425 vs 0.512). With good context enrichment, Gemma 4 closes much of the factual gap while maintaining its reasoning advantage.
On context investment strategy
The data gives clear guidance on where to invest in metadata enrichment:
High ROI: Semantic enrichment (L2) and quality metadata (L4) - these drive the majority of gains for context-sensitive tasks. The L4 jump from 0.59 to 0.71 for GPT-4o is almost entirely quality metadata.
Moderate ROI: Temporal enrichment (L1) - marginal for most tasks, but important for trend forecasting at lower model capability.
Negative ROI: Verbose lineage (L3 as implemented) - caused a measurable dip. Compact causal summaries are better than full graph traversal. Less is more when it comes to lineage context.
Task-based routing: Don’t enrich everything uniformly. Anomaly diagnosis doesn’t need enrichment. Batch comparison desperately does. Know your task profile before investing.
On the DEFER philosophy
The CEL gate is a statement about epistemic honesty in AI systems. A system that refuses to answer when uncertain is fundamentally more trustworthy than one that always provides an answer with false confidence.
The challenge is making that refusal useful operationally - routing to humans rather than scoring as zero, and calibrating the gate per task type rather than globally. HARD_FLOOR of 0.30 was too blunt: Batch Comparison needs a high threshold, Anomaly Diagnosis needs no threshold at all. Per-task threshold calibration is the natural next iteration.
The Technical Stack (For the Builders)
Everything was built in pure Python with no agentic framework abstractions. Deliberate choice - the paper must describe exactly what each component does, and frameworks obscure that.
Data: TEP simulation dataset (public), synthetic maintenance logs generated offline via GPT-4o-mini for semantic context. Custom ISA-88/ISA-95 ontology covering all 52 TEP variables.
Retrieval: Qdrant (local Docker) + Sentence-BERT (all-MiniLM-L6-v2). Context-level filtering prevents information leakage between experimental conditions - an L1 experiment retrieves only L1 records.
Inference: OpenAI Python SDK throughout. GPT-4o and GPT-5.4 via direct API. Gemma 4 via base_url="https://openrouter.ai/api/v1" - literally one line change, same codebase.
Evaluation: Rule-based scorer with LLM-as-judge validation on ambiguous outputs (0.4–0.6 range). All temperature=0.0, all seeded at 42.
Schema: Pydantic v2 throughout. Every cross-module data transfer is a typed model - never raw dicts. Every result row carries run_id, model_id, context_level, task_type, trial_number, and timestamp. Full provenance on every data point.
Cost breakdown:
- GPT-4o 775 trials: ~$8.50
- GPT-5.4 750 trials: ~$6.50
- Gemma 4 750 trials: $0.38
- CEL runs (1,525 trials): ~$7.00
- Total experiment cost: ~$22
Three Things I’d Do Differently
1. Statistical pre-enrichment gating. The Quality Enrichment Agent’s LLM-based interpretation should not be the primary gate signal. Replace with: missing value ratio + out-of-range proportion + sensor variance → statistical quality score → only then call the LLM for narrative interpretation. This breaks the bootstrapping dependency and would likely shift 100% DEFER at L0–L3 to a graduated response.
2. Per-task quality thresholds. A single global HARD_FLOOR is blunt. Batch Comparison’s 3x L0→L4 improvement justifies a high threshold. Anomaly Diagnosis’s near-zero sensitivity justifies no threshold. Calibrate θ per task type from the empirical curves.
3. Real messy data. The TEP dataset is a clean, well-understood simulation. Real industrial data has inconsistent naming conventions, undocumented sensors, missing calibration records, and sensor drift that the simulation doesn’t capture. The patterns I observed - semantic and quality being most important, lineage being verbose and noisy - may look different on production data. That’s where this research needs to go next.
Glossary of Abbreviations
Every term used in this post, defined plainly for readers from any background.
| Abbreviation | Full Form | Plain English |
|---|---|---|
| AI | Artificial Intelligence | Computer systems that perform tasks that normally require human reasoning |
| LLM | Large Language Model | An AI model trained on vast amounts of text that can understand and generate language - GPT-4o, GPT-5.4, and Gemma 4 are all LLMs |
| GPT | Generative Pre-trained Transformer | OpenAI’s family of language models. The “transformer” is the neural network architecture underneath |
| GPT-4o | GPT-4 Omni | OpenAI’s multimodal model (text + images). The “o” stands for omni |
| GPT-5.4 | GPT version 5.4 | OpenAI’s current frontier model as of April 2026, unifying the Codex and GPT lines |
| MoE | Mixture of Experts | A neural network architecture where only a subset of the model’s parameters activate for each input. Gemma 4 26B MoE activates only 3.8B of its 26B parameters per token - making it far cheaper to run |
| TEP | Tennessee Eastman Process | A chemical engineering benchmark simulation created by Downs & Vogel (1993), widely used in process control research. Contains 52 sensors, 21 fault types |
| XMEAS | Measured Variable | TEP naming convention for the 41 process measurement sensors (e.g. XMEAS(7) = reactor pressure) |
| XMV | Manipulated Variable | TEP naming convention for the 11 control variables (e.g. XMV(1) = D feed flow valve) |
| CEL | Context Enrichment Layer | The four-agent framework built in this study to autonomously enrich raw industrial data before it reaches the reasoning AI |
| API | Application Programming Interface | A standardised way for software to communicate. I called GPT-4o and GPT-5.4 via OpenAI’s API; Gemma 4 via OpenRouter’s API |
| RAG | Retrieval-Augmented Generation | A technique where relevant documents are retrieved from a database and injected into the LLM’s prompt to improve factual grounding. Used in our retrieval agent |
| ISA-88 | International Society of Automation Standard 88 | A standard for batch process control that defines how to structure process phases, operations, and equipment hierarchies |
| ISA-95 | International Society of Automation Standard 95 | A standard for integrating enterprise and control systems; defines a vocabulary for manufacturing operations |
| NLP | Natural Language Processing | The field of AI concerned with understanding and generating human language |
| NER | Named Entity Recognition | An NLP technique that identifies and classifies named entities (people, places, technical concepts) in text - used in our semantic enrichment agent |
| SBERT | Sentence-BERT | A variant of BERT that produces dense vector representations of sentences, enabling semantic similarity comparisons. Used in our retrieval module (model: all-MiniLM-L6-v2) |
| BERT | Bidirectional Encoder Representations from Transformers | Google’s foundational language model architecture (2018) that revolutionised NLP by reading text in both directions simultaneously |
| RCA | Root Cause Analysis | The process of identifying the fundamental source of a problem, as opposed to treating its symptoms |
| GxP | Good Practice (x = manufacturing, clinical, laboratory, etc.) | A family of quality standards in pharmaceutical and life sciences that govern how data must be collected, stored, and audited |
| FP&A | Financial Planning & Analysis | The corporate function responsible for forecasting, budgeting, and financial modelling |
| EHR | Electronic Health Record | Digital records of patient clinical information |
| MCP | Model Context Protocol | An emerging standard for how AI agents share context and intent across different tools and systems |
| PoC | Proof of Concept | A small-scale prototype built to validate whether an idea is technically feasible before full development |
| ESWA | Expert Systems with Applications | The Elsevier journal where this research is being submitted (Impact Factor: 8.5) |
| ROI | Return on Investment | The benefit gained relative to the cost incurred - used here to describe which enrichment dimensions are worth the engineering effort |
| BYOK | Bring Your Own Key | OpenRouter’s option to use your own provider API keys, giving you direct billing with the provider while using OpenRouter’s routing layer |
Appendix: Mathematical Principles and Equations
This section explains the statistics and mathematical concepts used in the study. Each is presented in plain language first, followed by the formal notation for technical readers.
A1. The Composite Score - How I Measured Agent Reliability
Every agent output was scored on three dimensions and combined into a single composite score (S) used as the primary dependent variable throughout the study.
Plain English: I graded each AI answer on three things - did it get the facts right, was the reasoning logical, and was the recommended action appropriate? Then I combined these into one overall score, weighting factual accuracy most heavily.
Formal definition:
$S = 0.40 \times FA + 0.35 \times RC + 0.25 \times AA$
Where:
- FA = Factual Accuracy (0.0–1.0) - correctness of claims against ground truth
- RC = Reasoning Coherence (0.0–1.0) - logical soundness of the chain-of-thought
- AA = Action Appropriateness (0.0–1.0) - whether the recommended action is safe and proportionate
Weights sum to 1.0. The 0.40 weight on FA reflects that getting facts right is the most critical requirement in industrial safety contexts.
A2. Context Quality Score - The Independent Variable
The context quality score (Q) is the composite measure of how metadata-rich a given record is. This was the independent variable I varied across experimental conditions.
Plain English: I gave each record a single number between 0 and 1 representing how much useful metadata it had attached to it. A raw sensor reading scores 0. A fully enriched record with temporal, semantic, lineage, and quality metadata scores ~0.85.
Formal definition:
$Q = w_T \cdot q_T + w_S \cdot q_S + w_L \cdot q_L + w_{QF} \cdot q_{QF}$
Where:
- $q_T$ = temporal score (1.0 if temporal metadata present, else 0.0)
- $q_s$ = semantic coverage ratio (fraction of tags successfully mapped to concepts)
- $q_L$ = lineage completeness (fraction of tags with provenance traced)
- $q_{QF}$ = quality flag score (1.0 − out-of-range ratio − missing ratio)
- Weights: $w_T = 0.25$, $w_S = 0.35$, $w_L = 0.20$, $w_{QF} = 0.20$
The semantic dimension receives the highest weight (0.35) because my pilot studies showed it contributed most to agent reliability - confirmed by the research results.
A3. Pearson Correlation - Testing H1
H1: There is a statistically significant positive relationship between context quality (Q) and agent reliability (S).
Plain English: I used Pearson’s r to measure whether higher-quality context consistently produces higher-scoring outputs. An r of 1.0 would mean perfect linear relationship; 0.0 means no relationship; negative values mean higher context quality actually hurts.
Formula:
$r = \frac{\sum_{i=1}^{n}(Q_i - \bar{Q})(S_i - \bar{S})}{\sqrt{\sum_{i=1}^{n}(Q_i - \bar{Q})^2 \cdot \sum_{i=1}^{n}(S_i - \bar{S})^2}}$
Where $Q_i$ and $S_i$ are the context quality score and composite score for observation $i$, and $\bar{Q}, \bar{S}$ are their respective means.
Our results:
| Model | r | p-value | Interpretation |
|---|---|---|---|
| GPT-4o | 0.210 | 3.9x10⁻⁹ | Significant - context quality matters |
| Gemma 4 | 0.161 | 9.2x10⁻⁶ | Significant - context quality matters |
| GPT-5.4 | 0.038 | 0.301 | Not significant - context quality does not measurably affect this model |
The p-value measures how likely this result would appear by chance. Values below 0.05 (5%) are conventionally considered statistically significant. GPT-4o’s p=3.9x10⁻⁹ means there is less than a 1-in-250-million chance this correlation is random noise.
A4. Sigmoid Model - Testing H2
H2: The relationship between context quality and reliability follows a sigmoid (S-curve) shape, with a sharp inflection point θ below which performance drops non-linearly.
Plain English: I tested whether performance improves gradually with context, or whether there’s a threshold effect - a specific point where performance suddenly jumps. Think of it like a light switch vs a dimmer.
The sigmoid function:
$f(Q) = \frac{L}{1 + e^{-k(Q - \theta)}}$
Where:
- L = the maximum (ceiling) value the curve approaches
- k = steepness of the curve (higher k = sharper cliff)
- θ (theta) = the inflection point - the context quality score at which the curve transitions from flat to steep
- e = Euler’s number (~2.718), the base of natural logarithms
Why I used R² to evaluate fit:
R-squared (R²) measures what fraction of the variation in S is explained by the sigmoid model. R²=1.0 means perfect fit. R²=0.0 means the model explains nothing more than the mean.
Our result: R²=0.043 overall (GPT-4o). The sigmoid fits poorly - meaning the relationship is not a smooth S-curve. Instead, the data shows a step function: near-flat performance from L0 to L3, then a sharp jump at L4. H2 was rejected.
This is not a failure - it’s a finding. A step function means the return on context investment is highly concentrated at the quality metadata dimension (L4), not distributed evenly across all enrichment levels.
A5. The CEL Gate Logic - Binary Threshold Decision
The CEL orchestrator makes a gate decision for every (record, task) pair using a binary threshold rule.
Plain English: Before letting the AI reason over a record, the gate checks whether the data is trustworthy enough. If yes, proceed. If no, defer to a human. The threshold (HARD_FLOOR) is the minimum quality score we’re willing to accept.
Formal rule:
$$ \text{Gate}(Q_{CEL}) = \begin{cases} \text{BYPASS} & \text{if task} \in {\text{anomaly_diagnosis, deviation_explanation}} \ \text{PROCEED} & \text{if task} \notin \text{BYPASS_TASKS} \text{ and } Q_{CEL} \geq \theta_{HF} \text{ and quality agent succeeded} \ \text{DEFER} & \text{otherwise} \end{cases} $$
Where $\theta_{HF} = 0.30$ is the HARD_FLOOR - set at the minimum observed composite score across all 3,800 trials.
What the gate decision means operationally:
| Decision | Research Scoring | Production Meaning |
|---|---|---|
| BYPASS | Baseline score used | Task is context-insensitive - reason directly |
| PROCEED | CEL-enriched score used | Context quality sufficient - reason with augmented context |
| DEFER | Scored as 0.0 (artefact) | Context quality insufficient - escalate to human |
The scoring artefact (DEFER = 0.0) is why aggregate CEL scores appear lower than baseline. In a real deployment, DEFER is a safety mechanism, not a failure.
A6. Exponential Backoff - Rate Limit Handling
Used in both the OpenAI client and OpenRouter client for retry logic.
Plain English: When an API call fails due to rate limiting, instead of immediately retrying (which would make things worse), the system waits progressively longer between each retry attempt.
Formula:
$\text{wait}(n) = 2^n \text{ seconds}$
Where $n$ is the attempt number (1, 2, 3…). So: wait 2s after first failure, 4s after second, 8s after third. Maximum 3 retries in our implementation.
A7. Sentence-BERT Cosine Similarity - Semantic Retrieval
Used in the retrieval agent to find similar enriched records given a query.
Plain English: SBERT converts text into a list of numbers (a vector) that represents its meaning. Two pieces of text that mean similar things will have similar vectors. I measure similarity using cosine similarity - how much the vectors point in the same direction.
*Formula:*
$$ \text{similarity}(A, B) = \cos(\theta) = \frac{A \cdot B}{|A| \cdot |B|} $$
Where A and B are the embedding vectors of two text passages, $A \cdot B$ is their dot product, and $|A|$, $|B|$ are their magnitudes (lengths). Ranges from −1 (opposite meaning) to 1 (identical meaning). In practice, SBERT embeddings for semantically related process descriptions typically score 0.6–0.9.