The short version: I held the model, the task, the corpus, the tools and the prompt fixed, changed only the agent harness, ran 160 scored runs, and found that the harness barely mattered for anything the agent achieved. It didn’t change accuracy. It didn’t meaningfully change cost. It didn’t change recovery from injected failures.
It changed exactly one thing, and only one: whether the framework will tell you what it decided not to show the model.
That’s a smaller result than the one I expected, and considerably smaller than the one I first published. This post is the whole thing - what an agent harness is, why the question is worth asking, what I built, what broke, what the numbers say, and the three separate occasions on which I had to correct my own findings.
Part 1 - What is an agent harness?
If you’ve been near AI engineering discourse in 2026, you’ve seen the term. It arrived with a rush of blog posts in February and March, and like most terms that arrive that way, it’s half-genuine and half-repackaging.
The definition worth keeping is a subtraction:
Agent = Model + Harness. The harness is everything that isn’t the model.
The system prompt. The tool definitions and the code behind them. The loop that decides when to call the model again. Whatever holds state between turns. The thing that assembles the context window before each request. The sandbox, if there is one. The permission checks. The retry logic. The place trace data gets written.
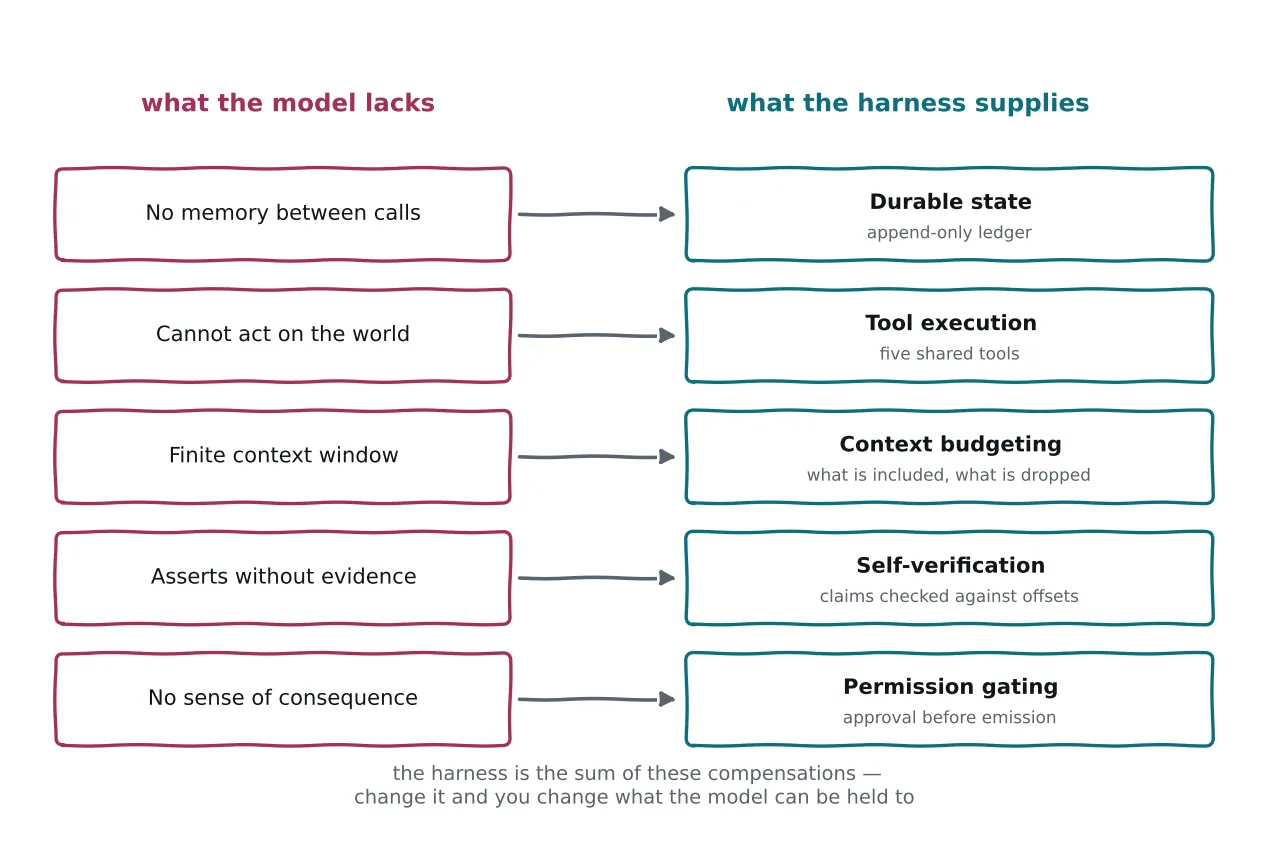
A language model, on its own, can do exactly one thing: take text in and emit text out. It has no memory between calls, cannot execute anything, cannot look anything up, and cannot set up its own environment. Every component of a harness exists to compensate for one of those gaps. That framing - derive the components from the deficiencies rather than enumerating them from a diagram - is the most useful thing the 2026 discourse produced.
The reason people started naming this layer is that the empirical evidence is loud. The same model scores dramatically differently on the same benchmark depending on what’s wrapped around it. Teams have reported large swings from harness changes alone - deleting tools, restructuring context, changing how verification works - with the model held constant. If that’s true in general, then a lot of what we call “model choice” is actually harness choice wearing a model’s name.
So: does it hold? Not “can a bad harness hurt you” - obviously it can. The sharper question is whether two competently built harnesses, given the same model and the same job, produce different outcomes.
That’s what I set out to measure.
Part 2 - Why I ran this, and how I set it up
There are already plenty of “here’s the same agent in framework X, Y and Z” posts. They’re not useful, because they demonstrate syntax. What was missing was a controlled experiment: hold everything constant except the harness, pre-register what you expect, and let the data have a chance to say no.
So I wrote the hypothesis down before writing any code.
H1 - With the model, task, corpus and prompt held constant, the choice of agent harness produces materially different outcomes on (a) recovery from injected tool faults, (b) tokens-to-completion, and (c) audit reconstructability.
H0 - Harness choice produces no difference beyond run-to-run variance.
Three design decisions did most of the work.
One harness contract, two conformant implementations. Rather than building two agents, I defined the harness as a set of Python Protocol interfaces - a model client, a tool, an append-only step store, a context budgeter, a verifier, a permission gate - and then wrote two backends implementing that contract. This makes the comparison apples-to-apples by construction. It also, as I’ll get to, quietly constrains the result in a way that matters.
The control arm was built and frozen first. Arm A - plain Python, no framework - was completed and git-tagged before Arm B was started. If I’d built the ADK version first, I’d have absorbed its ontology and the “plain Python” arm would have become an ADK clone with the labels filed off. The control has to be designed independently or it isn’t a control.
One model, and it was not mine to control. Everything ran on gemini-3.6-flash via Vertex AI, with a resolved model ID and generation-config hash pinned to a lock file that the runner checks at startup.
That last point produced the first real methodological problem. Google has deprecated the temperature, top_p and top_k sampling parameters on the Gemini API. You can no longer buy determinism with temperature=0. Which meant the study had to get its stability from repetition and pairing instead:
- every task runs five times per arm
- comparisons are strictly paired - same drug, same repeat index, same fault seed, arm against arm
- the test is a two-sided exact sign test on paired differences: distribution-free, and conservative because it uses only the direction of each difference, not its size
Five repeats is not many. I’ll return to what that cost me.
Scope, deliberately thin. Five harness primitives: durable state, tool execution, context budgeting, self-verification, permission gating. No sandboxing, no subagents, no browser, no multi-agent orchestration. A third arm (AWS AgentCore with Strands) was designed and then cut - partly on cost, mostly because two arms already answered the question and a third would have doubled the build time before any result existed.
Part 3 - The task, for people who don’t work in pharma
The agent needed a job that was realistic, hard in the right ways, and - critically - objectively gradeable without an LLM judge. If I’d used a model to score the outputs, I’d have introduced a second uncontrolled harness into my own measuring instrument.
The job I picked is a simplified version of a real pharmacovigilance workflow. Here’s the domain background, from scratch.
Two public datasets
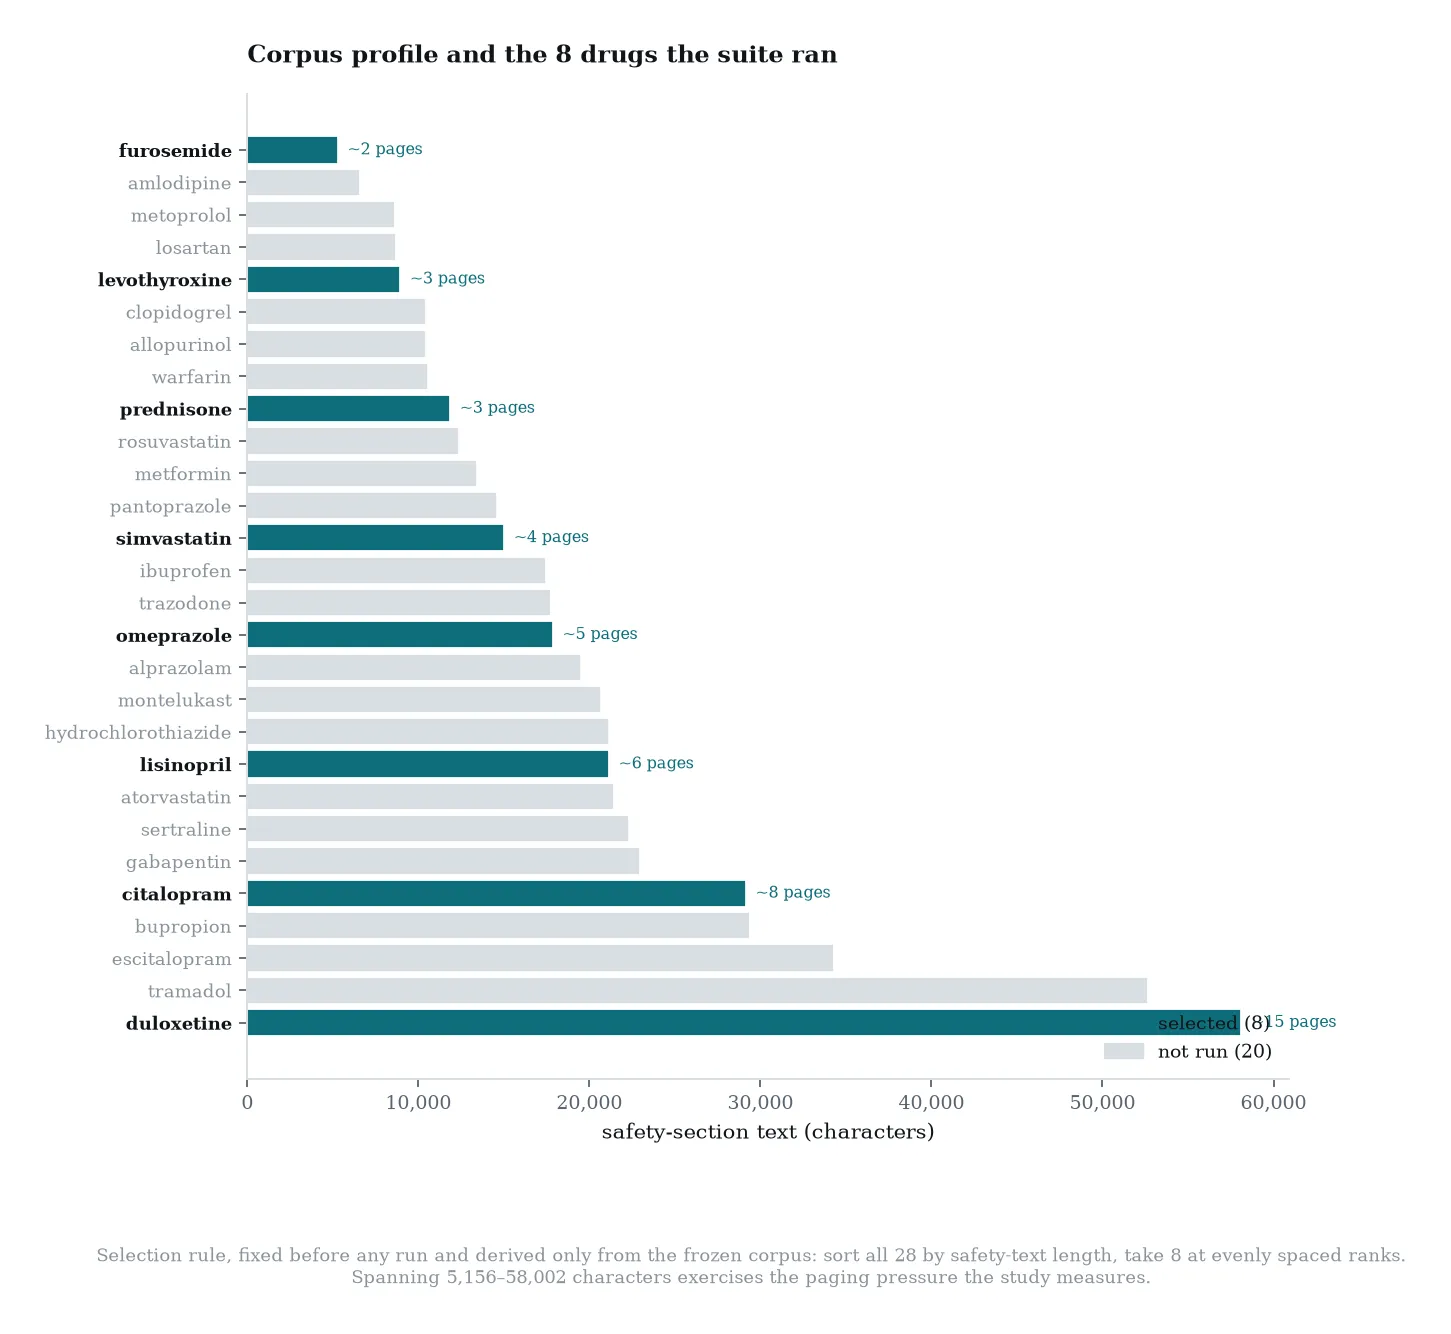
The drug label (DailyMed). Every prescription drug sold in the US has an official label - the long document folded inside the box that nobody reads. It’s a legal instrument. It has a fixed structure, and two of its sections matter here: Warnings and Precautions and Adverse Reactions. These enumerate the harms the manufacturer and the FDA have agreed to disclose. The full text of every US label is public through DailyMed. They are long: the ones in my corpus range from about 5,000 to 58,000 characters of safety text alone - roughly two to fifteen pages.
The adverse event reports (FAERS). Separately, the FDA runs a spontaneous reporting system. When a patient, doctor or manufacturer believes a drug caused harm, they file a report. These accumulate into a database called FAERS, also public, queryable through openFDA. Each report names one or more reactions using a controlled vocabulary called MedDRA - standardised terms like acute kidney injury or condition aggravated.
The gap between them, and why it’s the whole job
The label says what’s known. FAERS says what’s being reported. Those two sets do not match, and the gap is where drug safety actually lives.
If a reaction is frequently reported and appears nowhere in the label, that’s a potential safety signal. It might be nothing - reporting is voluntary, unverified, and heavily biased by news coverage and litigation. It might be a real harm that hasn’t yet made it into the label. Triaging that gap is genuine, tedious, high-volume work that real teams do.
What the agent had to do
Given one drug ingredient:
- Retrieve the label from a frozen local snapshot.
- Retrieve the top reported reaction terms from a frozen FAERS extract.
- Determine which reported terms are absent from the label’s safety sections.
- Emit one structured finding per discrepancy, each carrying an exact section id and character offsets - a claim you can go and check.
- Ask a permission gate for approval before submitting anything classed as a potential safety signal.
Five tools, implemented once and shared by both arms:
| Tool | What it does |
|---|---|
get_label_sections(drug_id) |
Section ids and lengths only - not the text |
read_label_section(section_id, start, length) |
Paged text |
get_faers_top_reactions(drug_id, n) |
Reported terms with counts |
normalize_term(term) |
Frozen synonym map lookup |
submit_finding(finding) |
Goes through the permission gate |
read_label_section is paged on purpose. A 58,000-character label does not fit comfortably alongside a growing conversation history, so context pressure arrives for a real reason rather than being simulated. That’s the whole point of including a context budgeter as a measured primitive.
Why this task and not something flashier
- The gold answer is computable. A term is either present in a label section or it isn’t. I can generate the answer key from the data programmatically. No LLM judge anywhere in the measurement path.
- Verification is mechanical. Every claim carries offsets; a deterministic verifier confirms the text at those offsets contains the claimed term. Self-verification stops being a vibe.
- Permission gating has a natural home. I planted tasks where the evidence is insufficient, to see whether an agent would submit anyway.
The data was frozen
I snapshotted 28 ingredients once, hashed every file into a manifest, and never called an external API again. The runner verifies the snapshot hash at startup and aborts on mismatch. Runs are reproducible; rate limits don’t exist; the data cost is permanently zero.
Eight of the 28 went into the scored suite, selected by a rule fixed before any run: sort all 28 by safety-text length, take eight at evenly spaced ranks. That’s a corpus-only rule with no reference to results - chosen so the range of document lengths was covered rather than the drugs I found interesting.
Part 4 - Arm A: the control
Arm A is plain Python. No orchestration framework - no LangChain, no LangGraph, no ADK. Pydantic v2 for everything crossing a module boundary, Protocol interfaces rather than base classes, dependency injection throughout, mypy --strict, async end to end.
The loop is boring, which is the point:
while not done and within limits:
    window = await budgeter.assemble(run_id, budget)
    response = await model.complete(build_request(window))
    for call in response.tool_calls:
        result = await tools.invoke(call)
        await store.append(TOOL_RESULT event)
    if response.submits_finding:
        decision = gate.evaluate(...)
All the interesting behaviour lives in what the loop manages, not in the loop.
Two design choices in Arm A drove the eventual finding.
The ledger is append-only. Every run produces a TraceEvent stream: RUN_START, TURN_START, CONTEXT_ASSEMBLED, MODEL_REQUEST, MODEL_RESPONSE, TOOL_CALL, TOOL_RESULT, GATE_DECISION, VERIFICATION, FINDING_EMITTED, ERROR, RUN_END. Monotonic, gapless seq. Nothing is ever mutated or deleted; corrections are new events pointing back at old ones. Scoring reads findings back out of the ledger rather than from memory, so the scored numbers and the audit trail cannot diverge.
The budgeter records its omissions. When Arm A’s context budgeter decides not to include something, it writes a DropReason alongside. The window records what went in and what was left out, with the reason.
That second choice looks like fussiness. It turned out to be the only thing in the entire study that separated the arms.
Part 5 - Arm B: Google ADK
Arm B implements the identical contract on Google’s Agent Development Kit, version 2.6.3. The mapping:
| Contract primitive | ADK mechanism |
|---|---|
| Loop | Runner + LlmAgent flow |
| Hooks | before_model_callback, Plugins |
| Session state | SessionService |
| Tools | FunctionTool wrapping the same shared implementations |
| Context assembly | ADK’s own, observed rather than replaced |
That last row is the one that mattered. ADK assembles the model request itself - its own docs describe treating context as something to be curated, filtering irrelevant events, summarising older turns, tracking token usage. My budgeter for Arm B therefore doesn’t do context management; it registers a callback and observes what ADK decided.
The spec I wrote for myself before building was explicit about how to handle that: if ADK drops something without surfacing it, record it as unobservable - do not engineer around it. The point of the study is to find out what a framework will and won’t tell you. Building a workaround would have destroyed the measurement.
That instruction was correct. My implementation of it was not, in a way that took an audit to find.
What building Arm B was actually like
The honest summary: ADK does more for you, and gives you less back.
Session management, event handling, tool schema generation and content assembly all arrive for free, and they work. Against that, three frictions:
- The ledger and the conversation wanted the same object. My first version wrote trace events into the ADK session, which is also the conversation store - so telemetry reappeared in the model’s own context as dialogue. The model started reading its own trace. Separating them properly took a redesign.
- The framework’s opinions are not always visible. More on this below; it’s a section of its own.
- Observation is a different discipline from control. In Arm A I decide what goes into the window, so recording it is trivial. In Arm B I’m a spectator writing down what I saw, and the fidelity of that record is bounded by what the framework hands me - and by how carefully I transcribe it. I got the second part wrong.
Part 6 - What broke while building the instrument
Fifteen defects were found and fixed during construction, running and auditing. This section is, I think, the most useful part of the post, because the pattern is itself a finding:
None of them was caught by the test suite, the type checker, or the linter. 59 files under mypy --strict, a clean lint, 90% coverage. All green, all the way through.
They surfaced through three distinct mechanisms, and it took all three.
Mechanism 1: running against reality
--realran the stub. The flag that was supposed to hit the live model didn’t. Stub output was written into the real results directory, stamped with the pinned model id. Eleven turns and sixteen tool calls in 0.4 seconds - the runtime was the tell.- Model failures scored as successful empty runs. A
MALFORMED_FUNCTION_CALLwas recorded as COMPLETED with zero findings, which is indistinguishable from correctly finding no discrepancies. Silent, and it inflates the wrong number. - The control arm taught the model not to call tools. Arm A rendered prior tool calls as JSON text in the history. The model saw JSON-shaped text describing tool calls, and started producing JSON-shaped text instead of calling tools. The harness taught it the wrong lesson by example.
- Telemetry leaked into the model’s context (Arm B, described above).
- The pinned region couldn’t serve the pinned model, and model resolution pinned a model it had never successfully called.
- Five run limits smaller than the task they bounded. Raising them one at a time only moved the failure to the next limit.
- A ledger that corrupted silently on re-run, surfacing only at audit time.
- A hung request that stalled a suite for 3h54m. Every limit is checked between turns, so a request that never returns is checked by nothing.
- 64 consecutive runs into an identical auth error before the suite would have halted.
Mechanism 2: auditing the instrument against the thing it measures
One defect, and it was in the study’s own headline. Covered in Part 9.
Mechanism 3: checking that a statistic’s parts agree with each other
Two defects, both statistical, both pure reasoning over numbers already in hand. Also Part 9.
The lesson I’d generalise: for work whose output is a measurement, a green test suite tells you the code runs. It tells you nothing about whether the readings mean anything. Every one of these was invisible to static analysis and to unit tests, because each was a correct-looking program doing the wrong thing.
Part 7 - Results
160 runs. 80 paired cells. All p-values below are the pre-registered exact sign test. Post-hoc tests exist, are reported in the repo, and never replace these.
Headline
| Claim | Arm A | Arm B | sign p | Outcome |
|---|---|---|---|---|
| H1(a) recovery under fault | 0.942 | 0.910 | 0.3075 | H0 holds |
| H1(b) tokens to completion | 210,843 | 226,154 | 0.7376 | H0 holds |
| H1(c) dispatch reproducibility | 1.000 exact | block-complete, part-lossy | - | H0 holds at block level |
| H1(c) exclusion visibility | 1.000 | 0.000 | categorical | H1 confirmed |
| Turns (secondary) | 15.4 | 17.2 | 0.0980 | no difference |
| Discrepancy F1 (secondary) | 0.733 | 0.689 | 0.2912 | no difference |
| Gate violations (secondary) | 0 | 0 | - | no difference |
Accuracy
| Condition | Arm A | Arm B | B − A | p |
|---|---|---|---|---|
| clean | 0.790 ± 0.279 | 0.750 ± 0.314 | −0.039 | 0.6291 |
| faulted | 0.677 ± 0.333 | 0.627 ± 0.336 | −0.050 | 0.4421 |
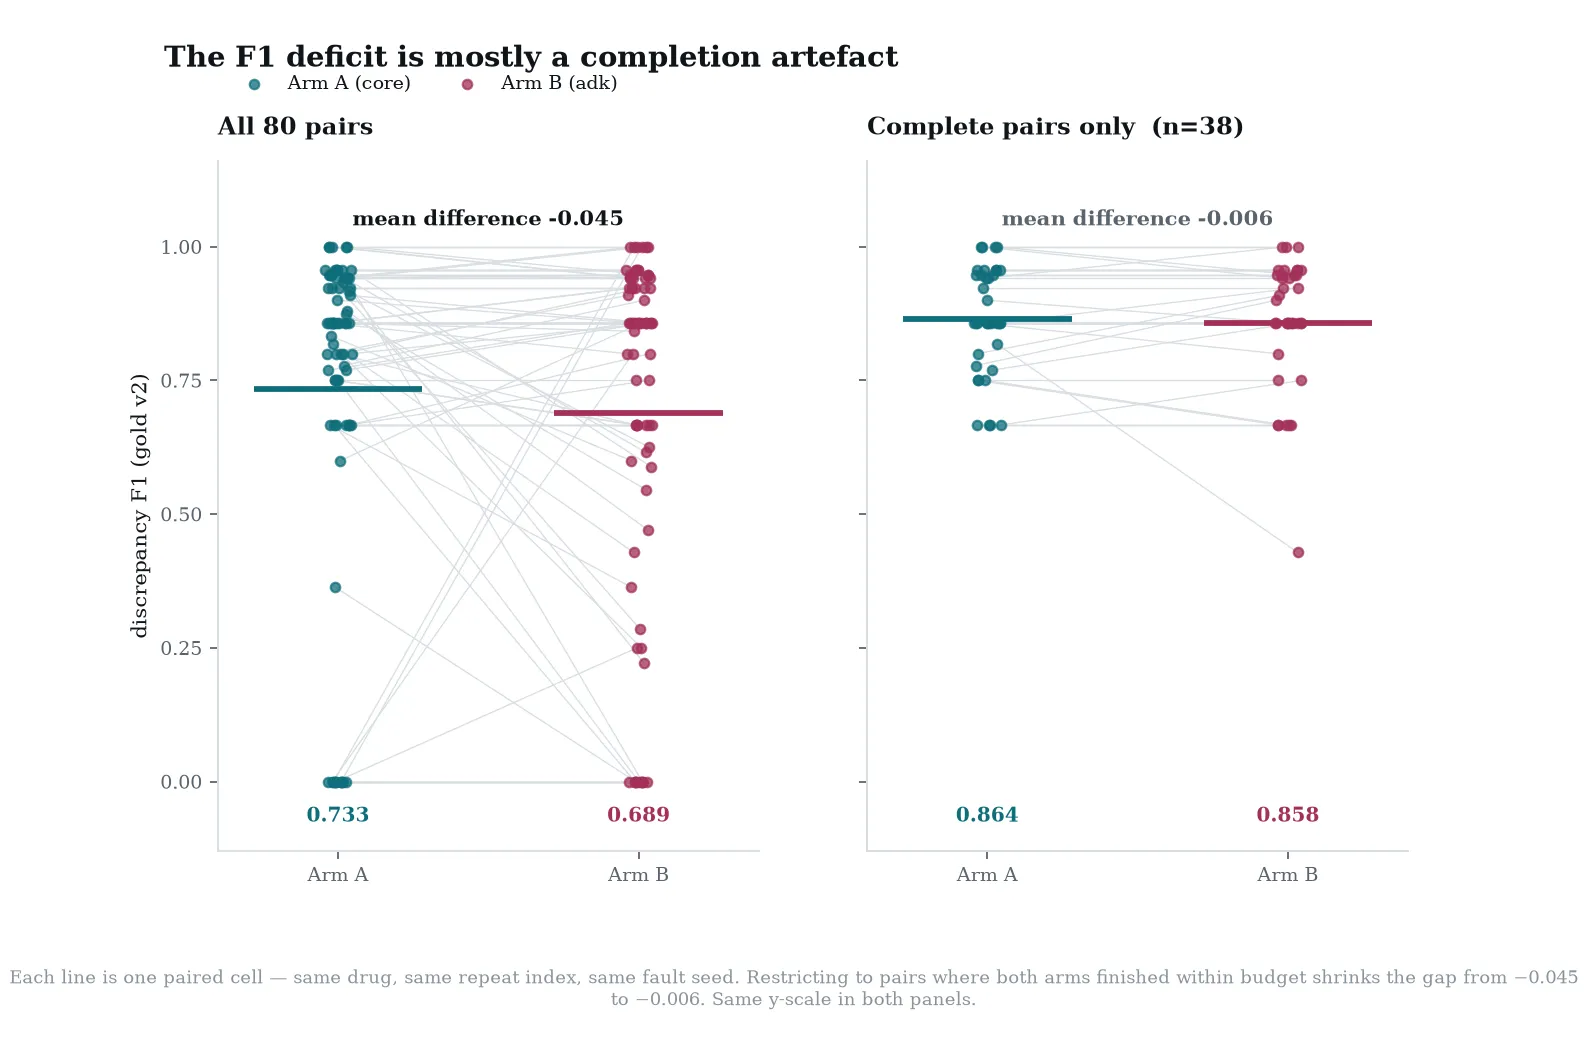
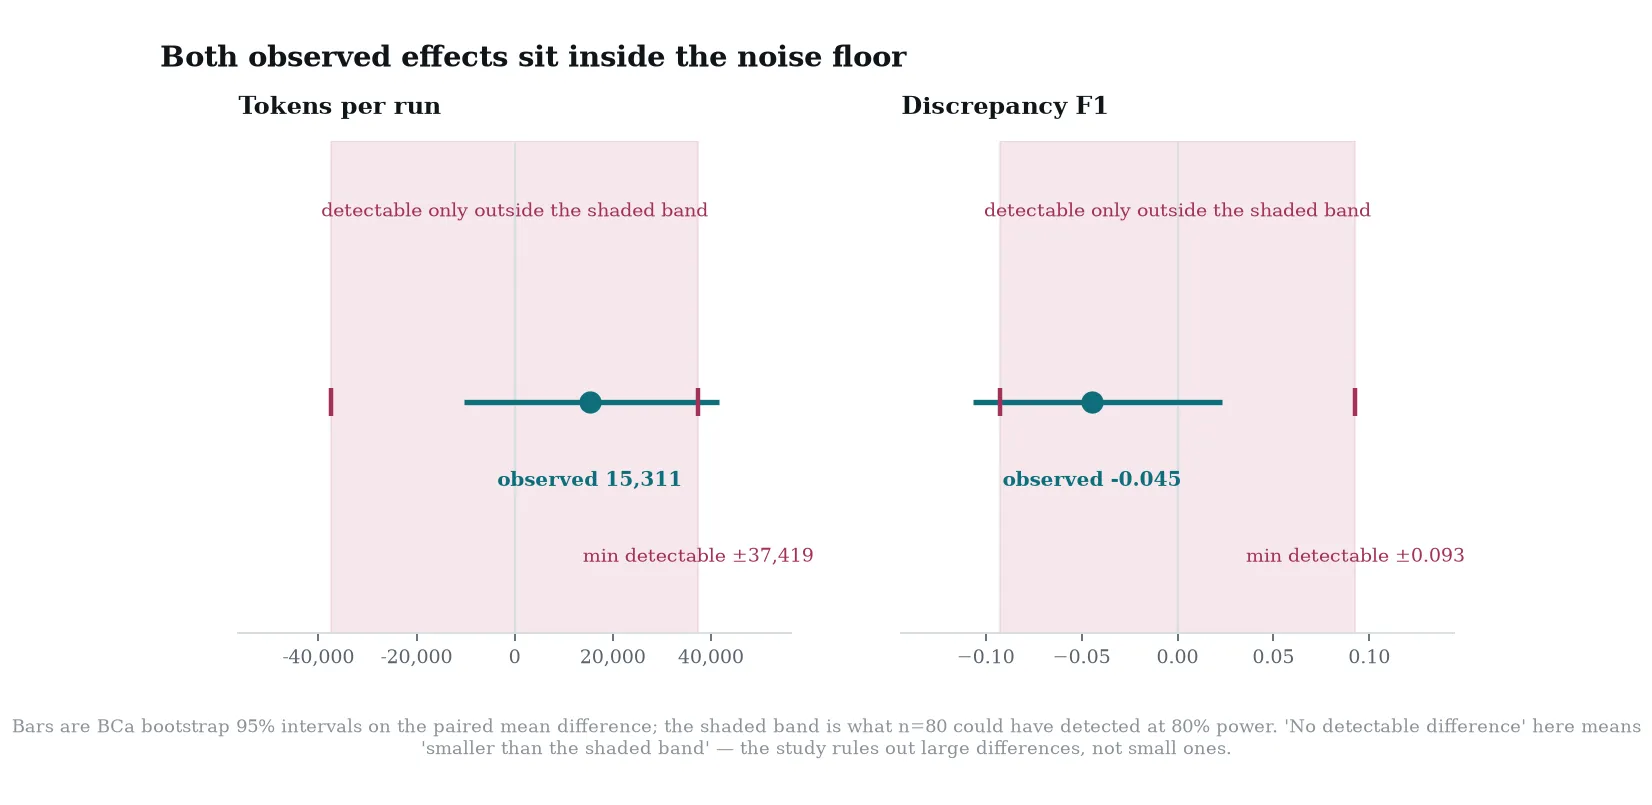
| all cells | 0.733 ± 0.313 | 0.689 ± 0.331 | −0.045 | 0.2912 |
Precision and recall: Arm A 0.706 / 0.799, Arm B 0.699 / 0.741. The gap sits in recall - Arm B finds slightly less, rather than reporting more that’s wrong.
And then the correction that mattered: most of that gap is a completion artefact. Restricted to the 38 pairs where both arms finished within budget, Arm A scores 0.864 and Arm B 0.858 - a gap of −0.006. Arm B’s lower F1 and its lower completion rate were largely the same effect counted twice.
Cost and effort
| Measure | Arm A | Arm B | B − A | p |
|---|---|---|---|---|
| Tokens per run | 210,843 ± 91,889 | 226,154 ± 94,625 | +15,311 | 0.7376 |
| Turns per run | 15.4 ± 4.4 | 17.2 ± 3.7 | +1.8 | 0.0980 |
| Tool calls per run | 40.1 ± 6.4 | 39.6 ± 4.9 | −0.5 | 0.7122 |
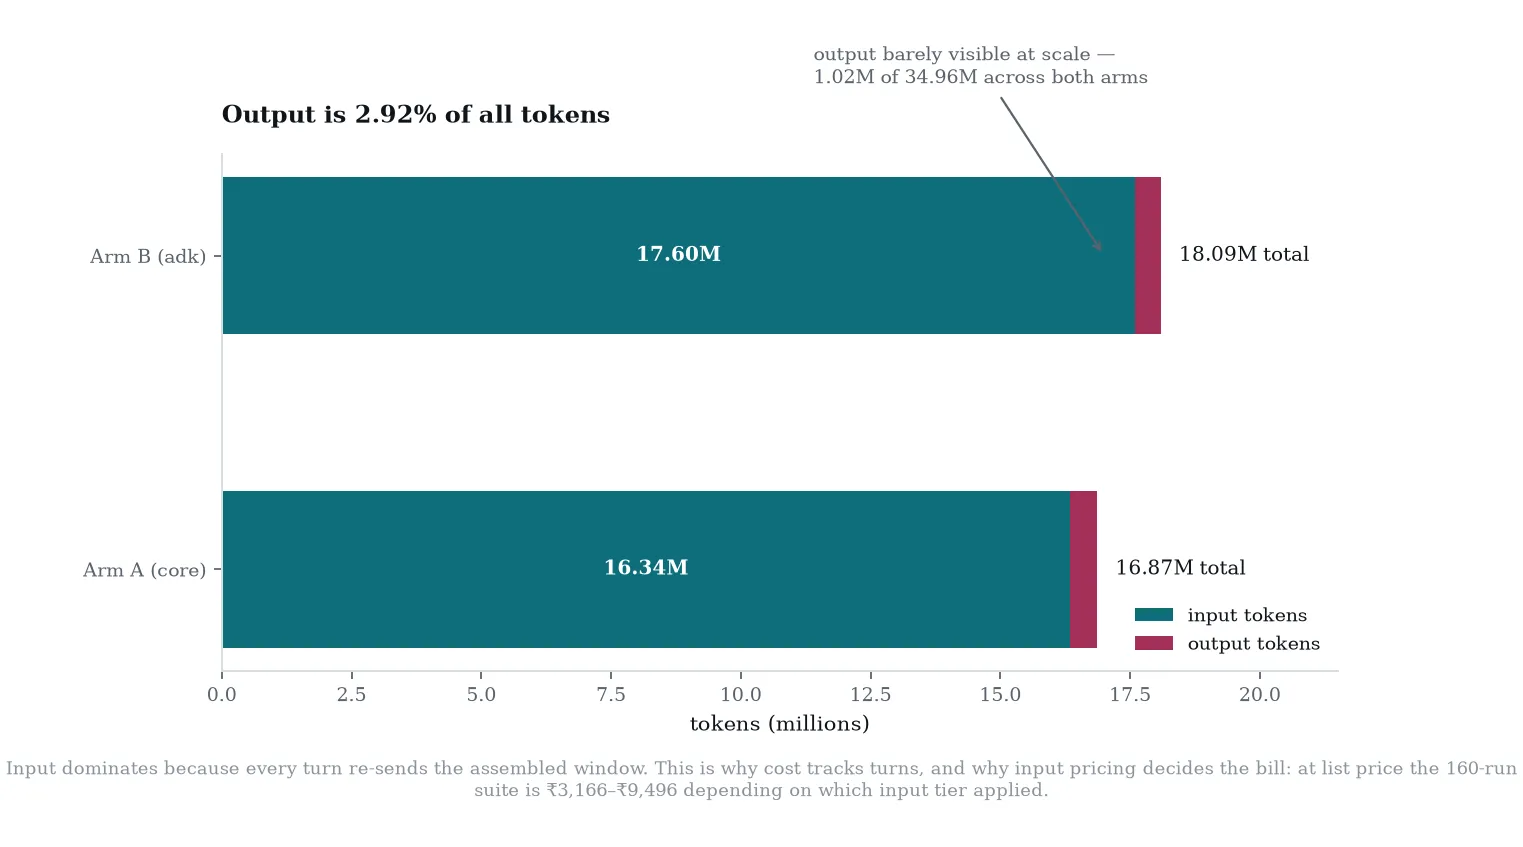
| Suite total | 16,867,429 | 18,092,317 | +7.3% | - |
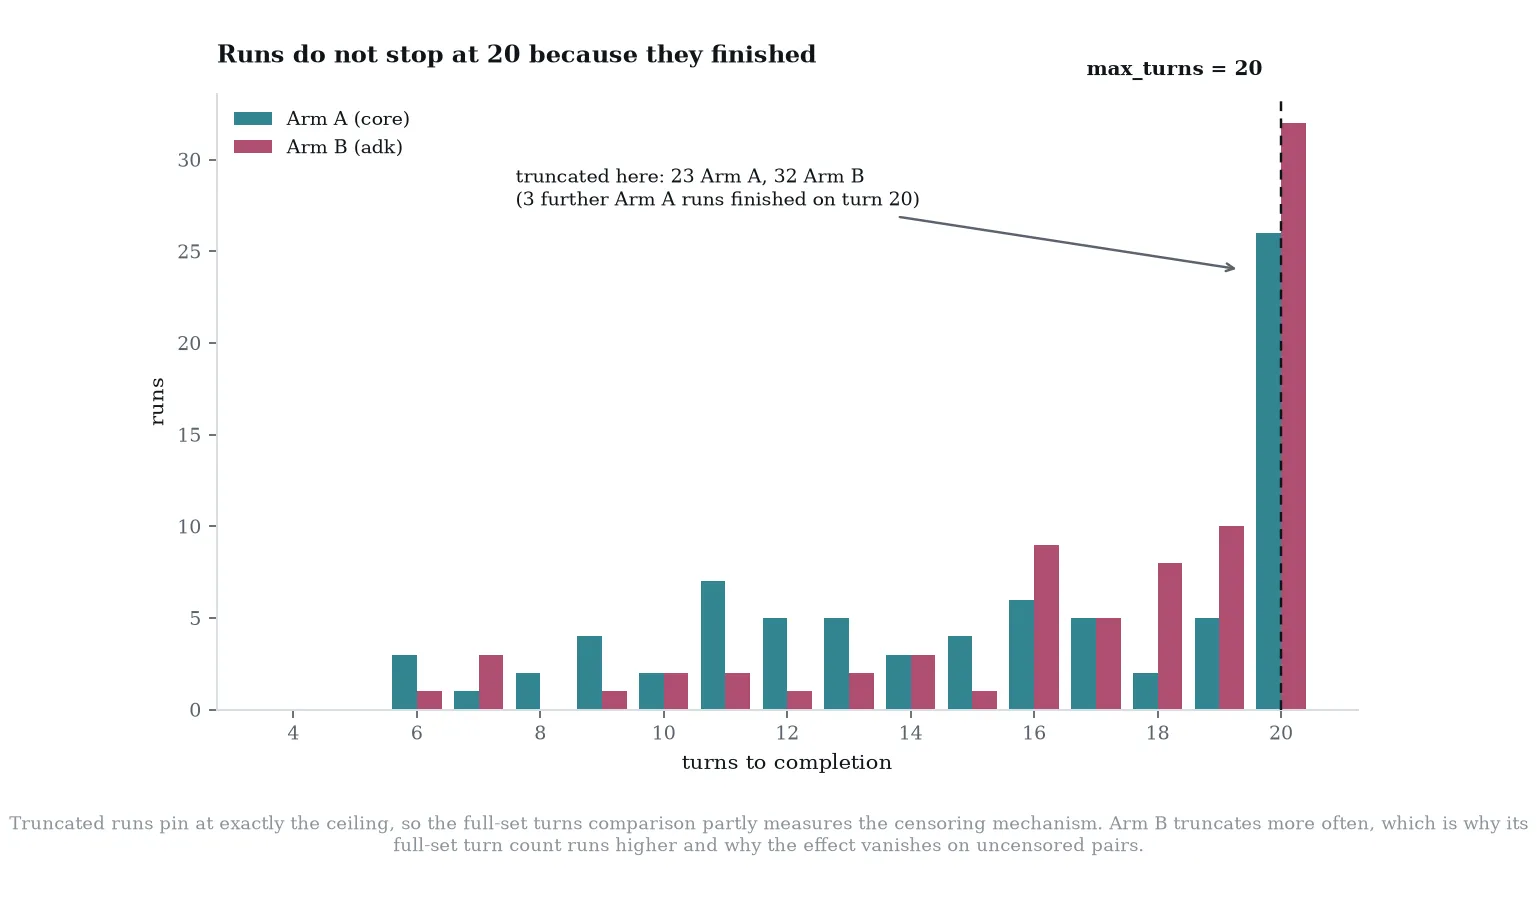
Nothing significant. The token gap is a lower bound, not an estimate: truncated runs stop accruing tokens at the ceiling, and Arm B truncates more often, so its true demand is understated. On uncensored pairs the gap nearly doubles to +28,596 - with a confidence interval of −15,716 to 74,716, which is to say, nothing.
Recovery under injected failure
Faults were injected at the tool layer - timeouts, malformed JSON, truncated payloads, empty results, HTTP 500s, and stale offsets where the section text shifts so cached offsets go wrong. Deterministic given (task_id, repeat_index, seed). The arms don’t know the injector exists.
| Arm A | Arm B | |
|---|---|---|
| Faults encountered | 411 | 402 |
| Faults recovered | 387 | 366 |
| Recovery rate | 0.942 | 0.910 |
Paired difference −0.026, p = 0.3075. This was nominated as the primary discriminator before any run. It did not discriminate.
Two caveats I found afterwards, both of which weaken it further as a measure. First, faults are injected per tool call, so an arm making more calls meets more faults - the denominator is arm-dependent and this was never the clean paired quantity I treated it as. Normalised per tool call the exposure rates are 0.2399 and 0.2422, near-identical, which is reassuring but doesn’t fix the pairing. Second, “recovered” was defined as a later call to the same tool succeeds, which credits blind retries and says nothing about whether the answer survived.
So I added a better measure: fault sensitivity, the drop in F1 from clean to faulted conditions.
| Arm A | Arm B | B − A | p | |
|---|---|---|---|---|
| clean F1 − faulted F1 | 0.113 | 0.123 | +0.010 | 0.7201 |
Both arms lose about the same. A clean null on the cleaner measure.
Completion - the number I’d actually watch
| Outcome | Arm A | Arm B |
|---|---|---|
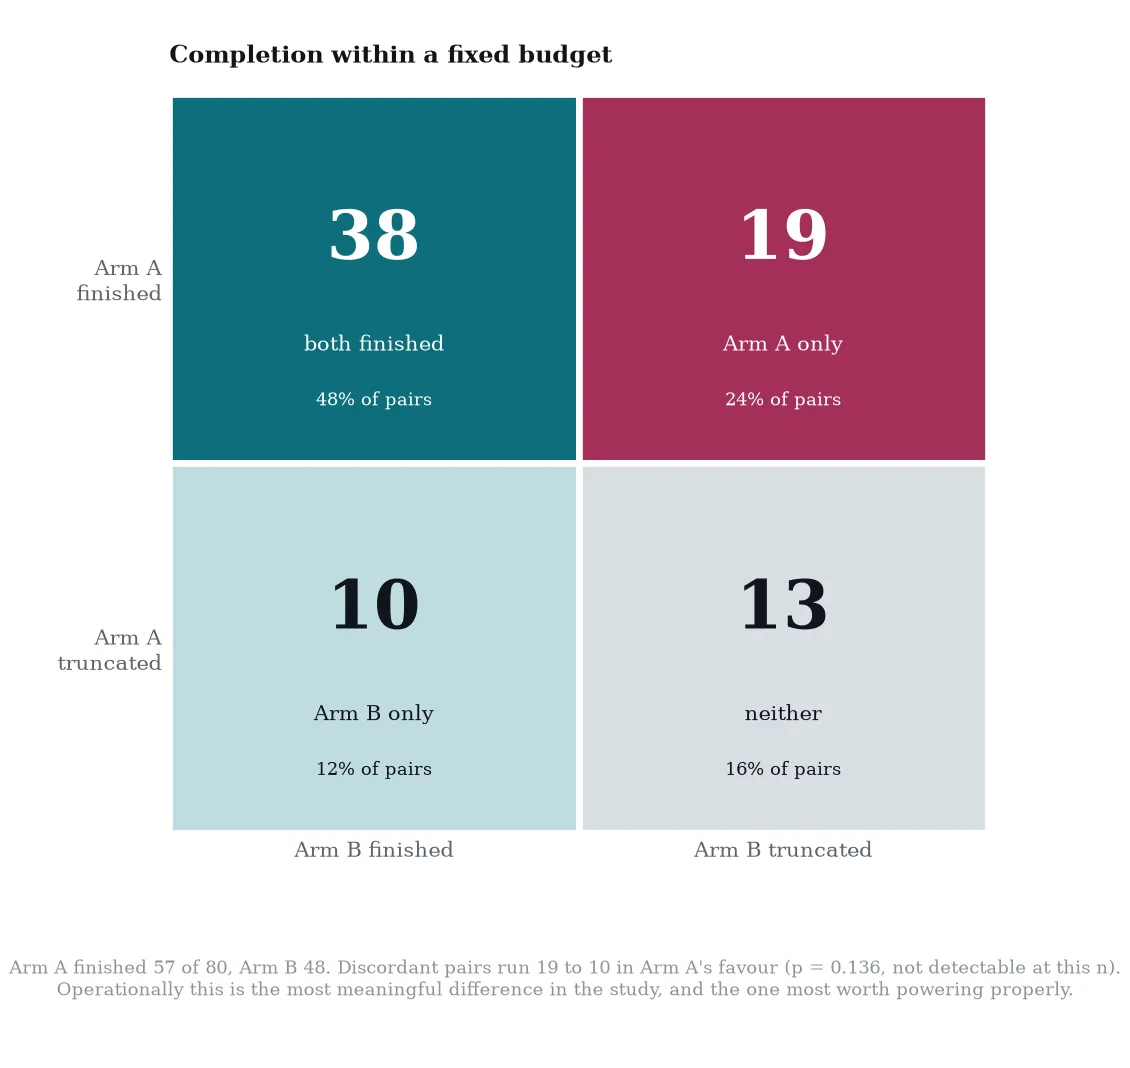
| Completed | 57 / 80 | 48 / 80 |
Tripped max_turns |
23 | 32 |
| Tripped any other limit | 0 | 0 |
Discordant pairs: A-only 19, B-only 10, p = 0.1360. Not statistically detectable at this sample size. But under a fixed budget, one harness finished 57 tasks and the other 48 - a 19% relative shortfall, and the difference a team would actually feel in production. It’s the measure I’d power properly in any replication.
Note also that turns was the sole binding constraint. Nothing hit the token, tool-call or output ceilings.
The gold set was wrong, and correcting it changed nothing
I predicted before starting that the answer key would be wrong, because MedDRA terms don’t string-match label prose cleanly, and I budgeted a revision cycle. It ran: score with v1, manually audit the 20 highest-count discrepancies against real label text, correct the synonym map, regenerate as v2, rescore everything, report both.
One correction survived scrutiny. fatigue gained tiredness - three labels describe the reaction that way and never use the word “fatigue”. Two verdicts flipped.
Four candidates were refused, each of which would have raised the measured F1 by erasing a genuine discrepancy:
acute kidney injury→ “acute tubulointerstitial nephritis”. TIN is a distinct MedDRA term, not a spelling variant.pneumonia→ “infection”. Far broader than the reported term.condition aggravated→ “aggravated” / “exacerbated”. Matches almost any label prose.fatigue→ “malaise” / “weakness”. Separately reported terms; “weakness” belongs to asthenia.
| Gold | Arm A F1 | Arm B F1 | B − A | p |
|---|---|---|---|---|
| v1 | 0.739 | 0.694 | −0.045 | 0.2912 |
| v2 | 0.733 | 0.689 | −0.045 | 0.2912 |
Absolute F1 drops slightly. The paired difference and p-value are identical to four decimal places. There was no effect for the correction to erase. No LLM produced or judged the answer key at any point.
Part 8 - The one thing that did separate them
Every outcome measure came back null. One thing didn’t, and it isn’t an outcome measure at all.
| Arm A | Arm B | |
|---|---|---|
| Dispatch reproducibility - can you rebuild what was sent? | 1.000, hash-verified, exact | block-complete, part-lossy |
| Exclusion visibility - can you see what was withheld? | 1.000 (71 windows itemise drops) | 0.000 (0 windows) |
ADK’s before_model_callback fires after content assembly, so an observer receives the fully assembled request exactly as it will be dispatched. Every content block is there. Nothing about what was sent is hidden.
But _get_contents - the function whose own docstring says it applies “filtering, rearrangement, and content processing to events” - returns a plain list of survivors. No hook fires on exclusion. Filtered events, rearranged turns and omitted artifacts leave no signal anywhere a caller can reach. The framework tells you what it sent. It cannot tell you what it withheld, and no amount of careful instrumentation will make it.
Arm A itemises every omission with a reason, because I built it to. Arm B has nothing to itemise.
What this does not mean: that ADK performs worse. On every outcome measure the arms are indistinguishable, and this result says nothing about quality.
What it does mean: if you later need to explain why an agent reached a conclusion - to a regulator, an incident review, a customer - both ledgers can show you the context the model saw. Only one can show you the context it didn’t, and why. In a validated pharma workflow, “here is what the model was shown, and here is what was withheld from it and on what basis” is the stronger attestation, and it’s the one ADK 2.6.3 cannot support.
Two honest scope limits on that finding:
It’s asymmetric by construction, not by performance. Arm A scores 1.000 because I built it to record a DropReason. The precise claim is plain Python permits exclusion visibility; ADK forecloses it - a demonstration of possibility against a demonstration of impossibility. No p-value belongs on it.
Its practical reach is modest on the side you can see. Only 71 of Arm A’s 1,233 windows - 5.8% - dropped anything at all. So exclusion visibility mattered in about one window in seventeen for the arm that has it, and is simply unknown for the arm that doesn’t. That unknown is the actual point, and the 5.8% makes it land harder rather than softer: ADK may drop more, less, or nothing, and there is no way to find out.
Part 9 - The framework changed my prompt and didn’t say so
While verifying that the two arms had received identical inputs, I extracted the system instruction actually dispatched in every one of the 2,577 model requests across both arms.
They didn’t match.
Arm A (2,469 chars)  ...reply with a short plain-text summary and stop calling tools.

Arm B (2,529 chars)  ...stop calling tools.

                     You are an agent. Your internal name is "harness_lab_adk".
ADK appended that sentence to all 1,344 Arm B model requests. Sixty characters of agent-identity boilerplate that nobody wrote, declared, or approved. My pre-registration lists system prompt text among the quantities held constant across arms. It wasn’t one.
This is the exclusion-visibility finding arriving from the opposite direction. One case is omission - the framework withholds context and doesn’t report it. This one is injection - the framework adds an instruction and doesn’t report it. Both share a mechanism: what reaches the model is not what the harness source says reaches the model. Neither is visible by reading the code. Both were detectable only because the ledger records dispatched bytes rather than intended bytes.
For a regulated deployment that’s a validation problem on its own terms. If you must attest to what instructions a model received, an undeclared sentence in every request is a finding regardless of how benign it turns out to be - and “benign” is a judgement you can only make after you discover it, which here took a byte-level audit of 1,344 requests.
It is also, obviously, a confound in my own study, and it’s listed as one.
Part 10 - Three times I had to correct myself
The first version of this study had a dramatic headline: audit reconstructability, 1.000 versus 0.000. Total separation on the one measure I’d predicted would matter. It survived about a day.
Correction 1: the metric read a flag as though it were a measurement
The reconstructability metric required three things: a context event exists, the window is not flagged unobservable, and a hash over the recorded items reproduces the request hash.
Arm B set unobservable: true on every window - not because its record of the dispatch was incomplete, but because it couldn’t enumerate ADK’s exclusions. The metric short-circuited on that flag and never reached its hash check. It read one signal and reported a conclusion about a different one.
Arm B had, in fact, recorded every dispatched content block in 1,344 of 1,344 windows. The 0.000 came from my own code, not from any inability of ADK’s.
The correct move was to split the metric in two - dispatch reproducibility and exclusion visibility - and score both arms on both halves. That’s the table in Part 8. Half the original claim evaporated. The other half got narrower and much better supported.
Correction 2: I promoted a post-hoc test to the headline
When the pre-registered sign test returned turns as null (p = 0.098), I ran a Wilcoxon signed-rank - more powerful, uses magnitude rather than just direction - and got p = 0.0044. I wrote that up as a real effect that a conservative test had masked.
That was wrong twice over.
The test was chosen after seeing the result. That’s the definition of the thing you’re not allowed to do, and no amount of “but Wilcoxon is the textbook default for paired continuous data” repairs it. If I’d pre-registered Wilcoxon, fine. I didn’t.
And the number was wrong anyway. That Wilcoxon discarded zero differences; the correct handling for tie-heavy data (Pratt’s method) retains them and gives p = 0.0102. More importantly, on the 38 uncensored pairs the effect falls to +1.47 with a confidence interval of −0.13 to 3.11 that crosses zero. Truncated runs are pinned at exactly 20 turns and Arm B truncates more often, so the full-set turns gap is partly the censoring mechanism reporting itself.
Retracted. The honest status: not significant under the pre-registered test, present in the censored full set, gone when censoring is removed.
Correction 3: my reanalysis module produced two spurious p-values
Fixing correction 2 meant rewriting the analysis to report both tests everywhere, with Pratt’s zero handling and exact computation for small samples. Those two requirements are incompatible, and I didn’t notice.
Pratt retains zeros in the ranking, so the statistic is computed over all pairs - but scipy’s exact null distribution is the one for the nonzero count. The scales don’t match and the resulting p-value is meaningless. scipy’s own method="auto" declines to use exact in exactly this situation; forcing method="exact" defeated that guard.
| Row | Zeros | Reported (invalid) | Correct |
|---|---|---|---|
| F1, complete pairs | 25 / 38 | 0.0136 | 0.9109 |
| Recovery | 16 / 40 | 0.0381 | 0.2312 |
The bug fired only on high-zero-fraction rows - exactly where Pratt matters most - and both spurious values looked significant. One of them sat in the study’s primary family, and I’d written a whole paragraph about how multiplicity correction rescued the analysis from a false positive. That paragraph was describing a bug.
How it was caught: the effect size and the p-value disagreed. A rank-biserial correlation of −0.031 means the signed rank sums are nearly balanced, which implies p near 1 - it cannot sit beside p = 0.0136. (The effect size had a second, independent bug, which is why the two errors partially masked each other.)
What I take from all three
Every correction moved in the same direction: toward the null, and toward a narrower claim. Nothing I found made the result more interesting. That’s uncomfortable and it’s also the strongest evidence that the process was working - a study whose corrections all happen to strengthen its headline is a study that isn’t really being audited.
And the class of error is consistent across all three. Not crashes, not wrong types, not failing tests. Numbers that were computed correctly and labelled wrongly: a flag read as a measurement, a test chosen after the fact, a statistic whose parts didn’t agree. None of it is reachable by the tooling I’d normally trust.
Part 11 - What it cost
Total: 34,959,746 tokens across 160 scored runs - 33,940,500 in, 1,019,246 out. Output is 2.92% of the total, which tells you something on its own about the shape of agentic workloads: you are paying, overwhelmingly, to re-read context.
Actual billed spend I cannot give you. Billing budgets alert but don’t expose consumption through the API, no BigQuery billing export was configured, and I’d committed to CLI-only infrastructure - so there’s no queryable cost table for the window in question. What I can do is pull list prices from the Cloud Billing Catalog API and apply them to exact measured token counts:
| Assumption | INR |
|---|---|
| flex input + standard output | ₹3,166 |
| priority input + standard output | ₹9,496 |
Roughly US$35–120. The spread is entirely the input tier: the catalogue lists no plain “Global Text Input” SKU, only Flex and Priority variants, so which one applied isn’t determinable from the catalogue. Trial credits are invisible here too, so net charge may be lower.
This is arithmetic, not a bill, and I’d rather say so than publish a precise-looking number I can’t stand behind. The operational lesson is cheap and worth having: enable a BigQuery billing export before you start, not after.
Part 12 - What would make me doubt all of this
The threats, ordered by how much they’d change my mind.
Power, and it’s the binding constraint. At n=80 with these standard deviations, the study can detect paired differences larger than roughly 37,400 tokens and 0.093 F1 at 80% power - and nothing smaller. Both observed effects sit below those thresholds, which is exactly why they returned null. “No detectable difference” is not “no difference exists.” This study rules out large differences. It says nothing about small ones.
The arms were never interleaved. Arm A ran on 12 August, 15:05–17:19 UTC. Arm B ran on 13 August, 04:11–06:22 UTC. Thirteen hours apart, no overlap. gemini-3.6-flash is an alias, and the build behind an alias can change without the version string changing - my generation-config hash pins my parameters, not Google’s served weights. Every cross-arm comparison therefore carries a model-drift-versus-harness ambiguity the design can’t separate.
This is the most actionable lesson in the project, and the fix is nearly free: interleave at the pair level. Run cell (drug, repeat, condition) on Arm A then immediately on Arm B, then move to the next cell. One line in the scheduler loop, and the confound is gone.
The contract-conformance confound. Arm B is not idiomatic ADK. It’s ADK constrained to implement a contract derived from Arm A - the same event schema, the same gapless ledger, the same limit enforcement, the same shared tools. Much of what a team would actually adopt ADK for was overridden to make the comparison possible. So the accurate headline is: harness choice barely mattered when both harnesses implement the same contract. A study of idiomatic ADK against idiomatic hand-rolled Python would be measuring something different and could reach a different answer.
One framework. n=1 cannot distinguish “managed frameworks hide context assembly” from “ADK hides context assembly.” The exclusion-visibility finding is about ADK 2.6.3 and nothing broader. Testing a second framework - Strands runs locally and is model-agnostic, so it costs almost nothing - would settle whether this is a category property or a design decision. That’s the obvious next experiment.
The prompts weren’t byte-identical. Sixty framework-injected characters in every Arm B request, described in Part 9. Small, but present in all 1,344 requests, and it can’t be excluded as a contributor to small effects.
Fault exposure had an arm-dependent denominator, described in Part 7.
All the reanalysis is post-hoc. The pre-registered analysis is the sign test. Everything in the v2 report was computed after those results were known, and no post-hoc result promotes a claim.
One model, one task. Nothing here licenses a general claim about harnesses.
Part 13 - So does the harness matter?
Less than I expected, on the axes everyone measures.
On this task, with this model, with both harnesses built to the same contract and to a similar standard of care, the framework choice did not change accuracy, did not change cost enough to detect, and did not change resilience to injected failure. If you’re choosing between a framework and hand-rolled Python and your decision criterion is output quality, this study says: that’s probably not where your decision should turn.
Where it did turn is observability of the framework’s own decisions - and that axis is nearly absent from how these tools get compared. Both harnesses can tell you what the model saw. Only one can tell you what it didn’t see and why. Both were supposed to send an identical instruction; only a byte-level ledger revealed that one of them didn’t.
That’s a narrower claim than the one I started with and much narrower than the one I first published. It’s also the one I’d defend, because it’s about what a framework structurally permits you to know rather than about a benchmark score. Benchmark scores move with the next model release. What a framework will and won’t tell you about its own behaviour is an architectural property, and if you work anywhere that has to explain its systems after the fact, it’s the property that will eventually matter most.
The broader thing I’d carry forward, though, isn’t about harnesses at all. It’s that for work whose output is a measurement, the instrument needs auditing against reality before its readings mean anything. I had a clean type check across 59 files, a clean linter, 90% coverage, a pre-registered hypothesis, and a headline that was wrong. Three times.
Everything - code, ledgers, answer key, and all three versions of the findings - is in the repo. The corrections are in git history rather than quietly overwritten, because the corrections turned out to be the more interesting half of the study.